Ecuadorian vs Immigrants from Nigeria Births to Unmarried Women
COMPARE
Ecuadorian
Immigrants from Nigeria
Births to Unmarried Women
Births to Unmarried Women Comparison
Ecuadorians
Immigrants from Nigeria
33.3%
BIRTHS TO UNMARRIED WOMEN
10.5/ 100
METRIC RATING
211th/ 347
METRIC RANK
35.4%
BIRTHS TO UNMARRIED WOMEN
0.7/ 100
METRIC RATING
247th/ 347
METRIC RANK
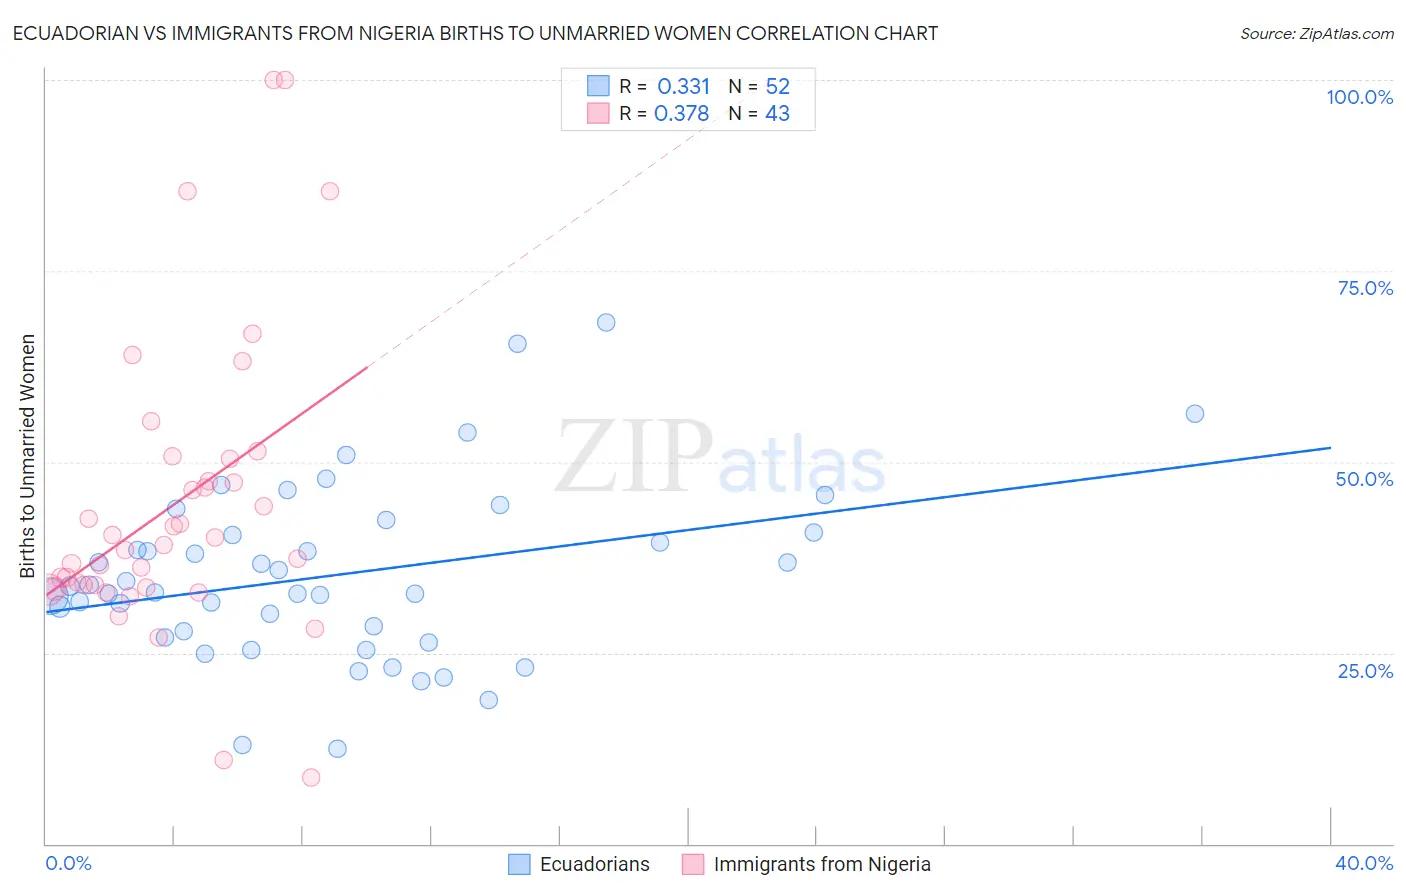
Ecuadorian vs Immigrants from Nigeria Births to Unmarried Women Correlation Chart
The statistical analysis conducted on geographies consisting of 300,726,329 people shows a mild positive correlation between the proportion of Ecuadorians and percentage of births to unmarried women in the United States with a correlation coefficient (R) of 0.331 and weighted average of 33.3%. Similarly, the statistical analysis conducted on geographies consisting of 272,772,821 people shows a mild positive correlation between the proportion of Immigrants from Nigeria and percentage of births to unmarried women in the United States with a correlation coefficient (R) of 0.378 and weighted average of 35.4%, a difference of 6.4%.
Births to Unmarried Women Correlation Summary
| Measurement | Ecuadorian | Immigrants from Nigeria |
| Minimum | 12.5% | 8.7% |
| Maximum | 68.3% | 100.0% |
| Range | 55.8% | 91.3% |
| Mean | 35.1% | 44.4% |
| Median | 33.3% | 39.0% |
| Interquartile 25% (IQ1) | 27.4% | 33.6% |
| Interquartile 75% (IQ3) | 40.6% | 50.4% |
| Interquartile Range (IQR) | 13.2% | 16.8% |
| Standard Deviation (Sample) | 11.5% | 19.4% |
| Standard Deviation (Population) | 11.3% | 19.2% |
Similar Demographics by Births to Unmarried Women
Demographics Similar to Ecuadorians by Births to Unmarried Women
In terms of births to unmarried women, the demographic groups most similar to Ecuadorians are White/Caucasian (33.3%, a difference of 0.050%), Scotch-Irish (33.3%, a difference of 0.050%), Celtic (33.3%, a difference of 0.070%), Hawaiian (33.2%, a difference of 0.19%), and Immigrants from Sudan (33.2%, a difference of 0.22%).
| Demographics | Rating | Rank | Births to Unmarried Women |
| Immigrants | Africa | 14.3 /100 | #204 | Poor 33.0% |
| German Russians | 13.1 /100 | #205 | Poor 33.1% |
| Uruguayans | 12.8 /100 | #206 | Poor 33.1% |
| Immigrants | Sudan | 11.5 /100 | #207 | Poor 33.2% |
| Hawaiians | 11.3 /100 | #208 | Poor 33.2% |
| Whites/Caucasians | 10.7 /100 | #209 | Poor 33.3% |
| Scotch-Irish | 10.7 /100 | #210 | Poor 33.3% |
| Ecuadorians | 10.5 /100 | #211 | Poor 33.3% |
| Celtics | 10.2 /100 | #212 | Poor 33.3% |
| Immigrants | Costa Rica | 9.5 /100 | #213 | Tragic 33.4% |
| Slovaks | 9.3 /100 | #214 | Tragic 33.4% |
| French | 8.7 /100 | #215 | Tragic 33.4% |
| Nepalese | 7.8 /100 | #216 | Tragic 33.5% |
| Spaniards | 7.0 /100 | #217 | Tragic 33.6% |
| Immigrants | Ecuador | 5.9 /100 | #218 | Tragic 33.7% |
Demographics Similar to Immigrants from Nigeria by Births to Unmarried Women
In terms of births to unmarried women, the demographic groups most similar to Immigrants from Nigeria are Nigerian (35.3%, a difference of 0.21%), Shoshone (35.3%, a difference of 0.32%), Nonimmigrants (35.5%, a difference of 0.33%), Bermudan (35.5%, a difference of 0.34%), and Guyanese (35.2%, a difference of 0.66%).
| Demographics | Rating | Rank | Births to Unmarried Women |
| Immigrants | Middle Africa | 1.2 /100 | #240 | Tragic 34.9% |
| Immigrants | Guyana | 1.2 /100 | #241 | Tragic 35.0% |
| Indonesians | 1.2 /100 | #242 | Tragic 35.0% |
| Japanese | 0.9 /100 | #243 | Tragic 35.2% |
| Guyanese | 0.9 /100 | #244 | Tragic 35.2% |
| Shoshone | 0.8 /100 | #245 | Tragic 35.3% |
| Nigerians | 0.7 /100 | #246 | Tragic 35.3% |
| Immigrants | Nigeria | 0.7 /100 | #247 | Tragic 35.4% |
| Immigrants | Nonimmigrants | 0.6 /100 | #248 | Tragic 35.5% |
| Bermudans | 0.6 /100 | #249 | Tragic 35.5% |
| Mexican American Indians | 0.4 /100 | #250 | Tragic 35.7% |
| Immigrants | Western Africa | 0.3 /100 | #251 | Tragic 36.0% |
| Salvadorans | 0.3 /100 | #252 | Tragic 36.0% |
| Immigrants | Portugal | 0.2 /100 | #253 | Tragic 36.2% |
| Potawatomi | 0.2 /100 | #254 | Tragic 36.2% |