Zimbabwean vs Immigrants from Eastern Europe Births to Unmarried Women
COMPARE
Zimbabwean
Immigrants from Eastern Europe
Births to Unmarried Women
Births to Unmarried Women Comparison
Zimbabweans
Immigrants from Eastern Europe
28.7%
BIRTHS TO UNMARRIED WOMEN
98.2/ 100
METRIC RATING
78th/ 347
METRIC RANK
27.6%
BIRTHS TO UNMARRIED WOMEN
99.6/ 100
METRIC RATING
42nd/ 347
METRIC RANK
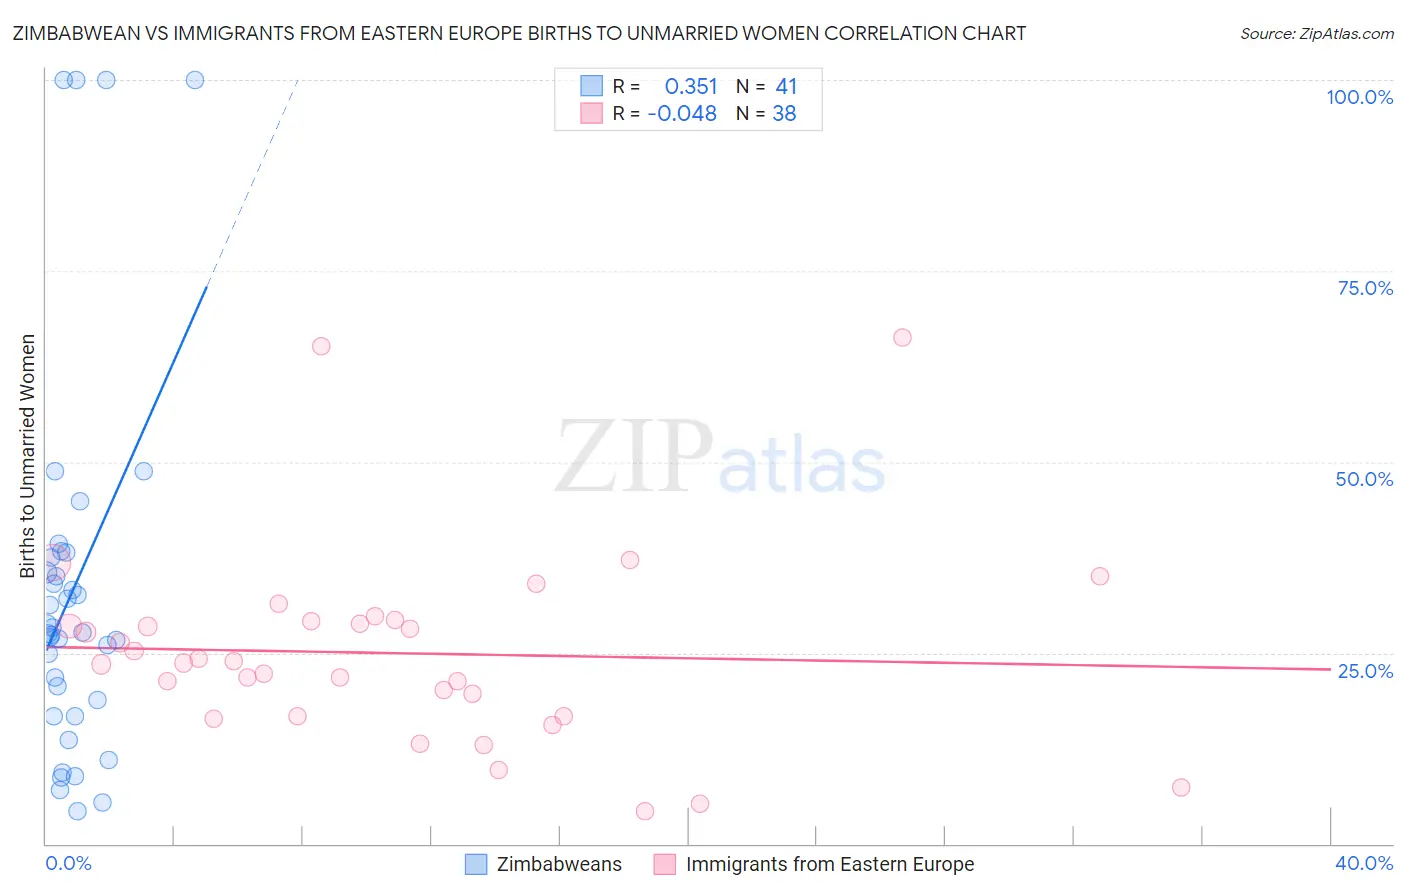
Zimbabwean vs Immigrants from Eastern Europe Births to Unmarried Women Correlation Chart
The statistical analysis conducted on geographies consisting of 68,374,099 people shows a mild positive correlation between the proportion of Zimbabweans and percentage of births to unmarried women in the United States with a correlation coefficient (R) of 0.351 and weighted average of 28.7%. Similarly, the statistical analysis conducted on geographies consisting of 434,188,066 people shows no correlation between the proportion of Immigrants from Eastern Europe and percentage of births to unmarried women in the United States with a correlation coefficient (R) of -0.048 and weighted average of 27.6%, a difference of 4.1%.
Births to Unmarried Women Correlation Summary
| Measurement | Zimbabwean | Immigrants from Eastern Europe |
| Minimum | 4.3% | 4.2% |
| Maximum | 100.0% | 66.3% |
| Range | 95.7% | 62.1% |
| Mean | 33.3% | 25.0% |
| Median | 27.6% | 23.8% |
| Interquartile 25% (IQ1) | 17.8% | 16.7% |
| Interquartile 75% (IQ3) | 37.9% | 29.2% |
| Interquartile Range (IQR) | 20.1% | 12.5% |
| Standard Deviation (Sample) | 25.0% | 12.8% |
| Standard Deviation (Population) | 24.7% | 12.6% |
Similar Demographics by Births to Unmarried Women
Demographics Similar to Zimbabweans by Births to Unmarried Women
In terms of births to unmarried women, the demographic groups most similar to Zimbabweans are Danish (28.7%, a difference of 0.020%), Immigrants from Afghanistan (28.7%, a difference of 0.050%), Immigrants from Austria (28.7%, a difference of 0.090%), Immigrants from Northern Europe (28.6%, a difference of 0.16%), and Romanian (28.7%, a difference of 0.20%).
| Demographics | Rating | Rank | Births to Unmarried Women |
| Jordanians | 98.5 /100 | #71 | Exceptional 28.5% |
| Immigrants | Sweden | 98.5 /100 | #72 | Exceptional 28.5% |
| Albanians | 98.5 /100 | #73 | Exceptional 28.5% |
| Immigrants | Bolivia | 98.5 /100 | #74 | Exceptional 28.6% |
| Immigrants | Switzerland | 98.4 /100 | #75 | Exceptional 28.6% |
| Israelis | 98.4 /100 | #76 | Exceptional 28.6% |
| Immigrants | Northern Europe | 98.3 /100 | #77 | Exceptional 28.6% |
| Zimbabweans | 98.2 /100 | #78 | Exceptional 28.7% |
| Danes | 98.2 /100 | #79 | Exceptional 28.7% |
| Immigrants | Afghanistan | 98.1 /100 | #80 | Exceptional 28.7% |
| Immigrants | Austria | 98.1 /100 | #81 | Exceptional 28.7% |
| Romanians | 98.0 /100 | #82 | Exceptional 28.7% |
| Immigrants | Kuwait | 98.0 /100 | #83 | Exceptional 28.8% |
| Immigrants | Poland | 97.6 /100 | #84 | Exceptional 28.9% |
| Sri Lankans | 97.5 /100 | #85 | Exceptional 28.9% |
Demographics Similar to Immigrants from Eastern Europe by Births to Unmarried Women
In terms of births to unmarried women, the demographic groups most similar to Immigrants from Eastern Europe are Iraqi (27.6%, a difference of 0.020%), Immigrants from Bulgaria (27.6%, a difference of 0.23%), Turkish (27.4%, a difference of 0.43%), Immigrants from Indonesia (27.7%, a difference of 0.49%), and Latvian (27.7%, a difference of 0.58%).
| Demographics | Rating | Rank | Births to Unmarried Women |
| Immigrants | Ireland | 99.7 /100 | #35 | Exceptional 27.2% |
| Immigrants | Western Asia | 99.7 /100 | #36 | Exceptional 27.2% |
| Immigrants | Ukraine | 99.7 /100 | #37 | Exceptional 27.2% |
| Immigrants | Moldova | 99.7 /100 | #38 | Exceptional 27.3% |
| Immigrants | Malaysia | 99.7 /100 | #39 | Exceptional 27.4% |
| Turks | 99.6 /100 | #40 | Exceptional 27.4% |
| Iraqis | 99.6 /100 | #41 | Exceptional 27.6% |
| Immigrants | Eastern Europe | 99.6 /100 | #42 | Exceptional 27.6% |
| Immigrants | Bulgaria | 99.6 /100 | #43 | Exceptional 27.6% |
| Immigrants | Indonesia | 99.5 /100 | #44 | Exceptional 27.7% |
| Latvians | 99.5 /100 | #45 | Exceptional 27.7% |
| Immigrants | Lithuania | 99.5 /100 | #46 | Exceptional 27.7% |
| Hmong | 99.5 /100 | #47 | Exceptional 27.7% |
| Eastern Europeans | 99.5 /100 | #48 | Exceptional 27.7% |
| Immigrants | Greece | 99.4 /100 | #49 | Exceptional 27.8% |