Dutch vs Osage Currently Married
COMPARE
Dutch
Osage
Currently Married
Currently Married Comparison
Dutch
Osage
49.6%
CURRENTLY MARRIED
99.9/ 100
METRIC RATING
13th/ 347
METRIC RANK
47.5%
CURRENTLY MARRIED
87.9/ 100
METRIC RATING
122nd/ 347
METRIC RANK
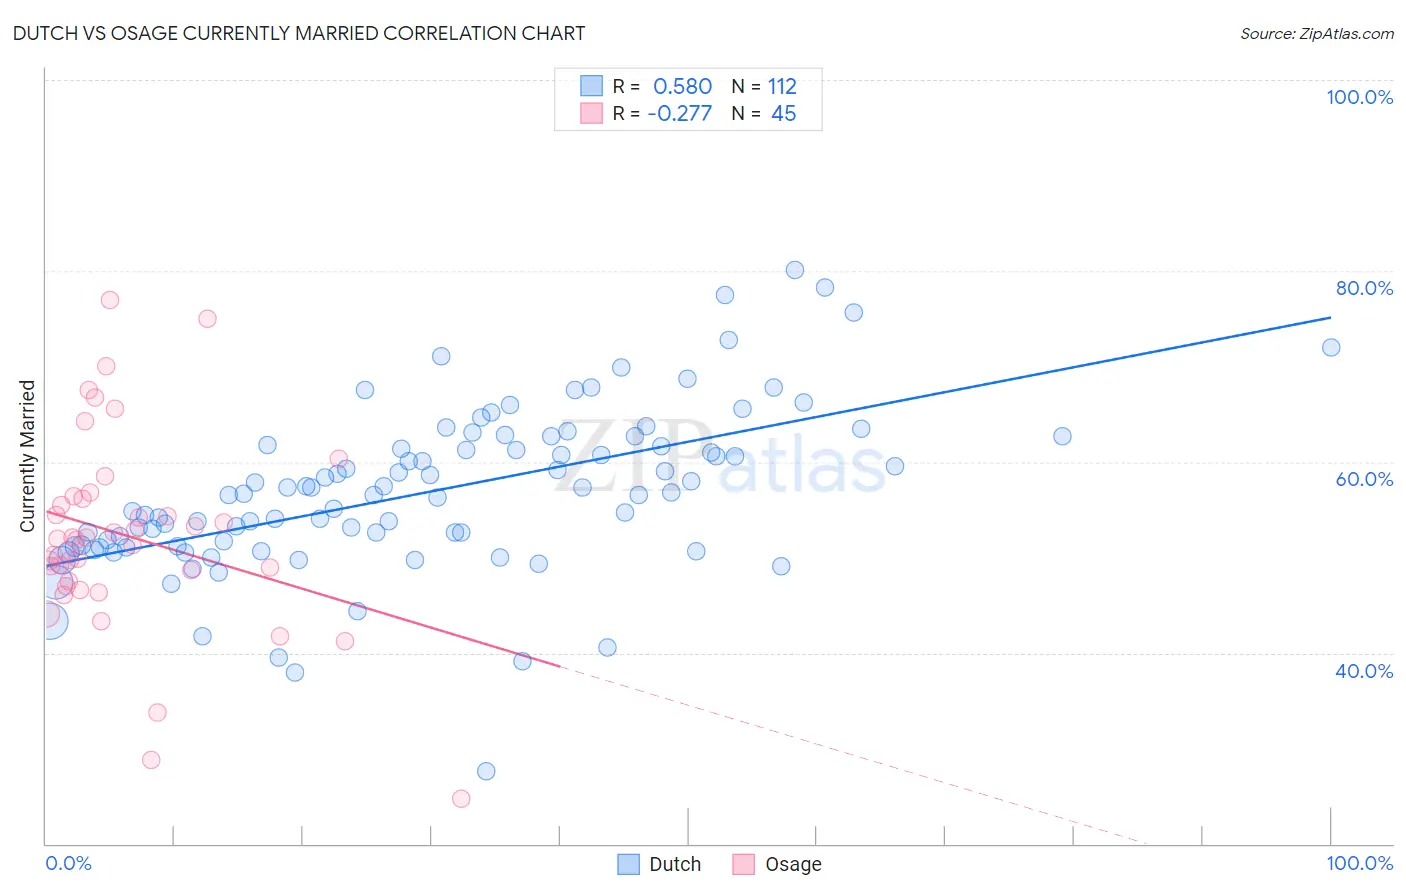
Dutch vs Osage Currently Married Correlation Chart
The statistical analysis conducted on geographies consisting of 554,255,721 people shows a substantial positive correlation between the proportion of Dutch and percentage of population currently married in the United States with a correlation coefficient (R) of 0.580 and weighted average of 49.6%. Similarly, the statistical analysis conducted on geographies consisting of 91,806,752 people shows a weak negative correlation between the proportion of Osage and percentage of population currently married in the United States with a correlation coefficient (R) of -0.277 and weighted average of 47.5%, a difference of 4.5%.
Currently Married Correlation Summary
| Measurement | Dutch | Osage |
| Minimum | 27.6% | 24.7% |
| Maximum | 80.1% | 76.9% |
| Range | 52.5% | 52.2% |
| Mean | 56.8% | 52.2% |
| Median | 56.6% | 51.9% |
| Interquartile 25% (IQ1) | 51.2% | 47.2% |
| Interquartile 75% (IQ3) | 61.7% | 56.3% |
| Interquartile Range (IQR) | 10.6% | 9.1% |
| Standard Deviation (Sample) | 8.6% | 10.3% |
| Standard Deviation (Population) | 8.6% | 10.2% |
Similar Demographics by Currently Married
Demographics Similar to Dutch by Currently Married
In terms of currently married, the demographic groups most similar to Dutch are German (49.6%, a difference of 0.010%), Pennsylvania German (49.6%, a difference of 0.040%), Chinese (49.5%, a difference of 0.18%), Scandinavian (49.5%, a difference of 0.20%), and English (49.7%, a difference of 0.26%).
| Demographics | Rating | Rank | Currently Married |
| Norwegians | 100.0 /100 | #6 | Exceptional 50.2% |
| Immigrants | South Central Asia | 100.0 /100 | #7 | Exceptional 50.0% |
| Swedes | 100.0 /100 | #8 | Exceptional 50.0% |
| Czechs | 99.9 /100 | #9 | Exceptional 49.9% |
| Filipinos | 99.9 /100 | #10 | Exceptional 49.7% |
| English | 99.9 /100 | #11 | Exceptional 49.7% |
| Swiss | 99.9 /100 | #12 | Exceptional 49.7% |
| Dutch | 99.9 /100 | #13 | Exceptional 49.6% |
| Germans | 99.9 /100 | #14 | Exceptional 49.6% |
| Pennsylvania Germans | 99.9 /100 | #15 | Exceptional 49.6% |
| Chinese | 99.9 /100 | #16 | Exceptional 49.5% |
| Scandinavians | 99.9 /100 | #17 | Exceptional 49.5% |
| Immigrants | Scotland | 99.8 /100 | #18 | Exceptional 49.3% |
| Europeans | 99.8 /100 | #19 | Exceptional 49.3% |
| Luxembourgers | 99.8 /100 | #20 | Exceptional 49.3% |
Demographics Similar to Osage by Currently Married
In terms of currently married, the demographic groups most similar to Osage are Immigrants from Croatia (47.5%, a difference of 0.060%), Immigrants from Kazakhstan (47.4%, a difference of 0.060%), Syrian (47.5%, a difference of 0.090%), Laotian (47.4%, a difference of 0.11%), and Okinawan (47.4%, a difference of 0.20%).
| Demographics | Rating | Rank | Currently Married |
| Immigrants | Indonesia | 90.5 /100 | #115 | Exceptional 47.6% |
| Palestinians | 90.4 /100 | #116 | Exceptional 47.6% |
| Puget Sound Salish | 90.3 /100 | #117 | Exceptional 47.6% |
| Immigrants | Philippines | 90.2 /100 | #118 | Exceptional 47.6% |
| Australians | 90.2 /100 | #119 | Exceptional 47.6% |
| Syrians | 88.9 /100 | #120 | Excellent 47.5% |
| Immigrants | Croatia | 88.6 /100 | #121 | Excellent 47.5% |
| Osage | 87.9 /100 | #122 | Excellent 47.5% |
| Immigrants | Kazakhstan | 87.2 /100 | #123 | Excellent 47.4% |
| Laotians | 86.6 /100 | #124 | Excellent 47.4% |
| Okinawans | 85.3 /100 | #125 | Excellent 47.4% |
| Immigrants | Jordan | 84.9 /100 | #126 | Excellent 47.4% |
| New Zealanders | 84.9 /100 | #127 | Excellent 47.4% |
| Portuguese | 84.2 /100 | #128 | Excellent 47.3% |
| Sri Lankans | 83.2 /100 | #129 | Excellent 47.3% |