Dominican vs Peruvian Married-couple Households
COMPARE
Dominican
Peruvian
Married-couple Households
Married-couple Households Comparison
Dominicans
Peruvians
38.2%
MARRIED-COUPLE HOUSEHOLDS
0.0/ 100
METRIC RATING
340th/ 347
METRIC RANK
47.6%
MARRIED-COUPLE HOUSEHOLDS
93.8/ 100
METRIC RATING
112th/ 347
METRIC RANK
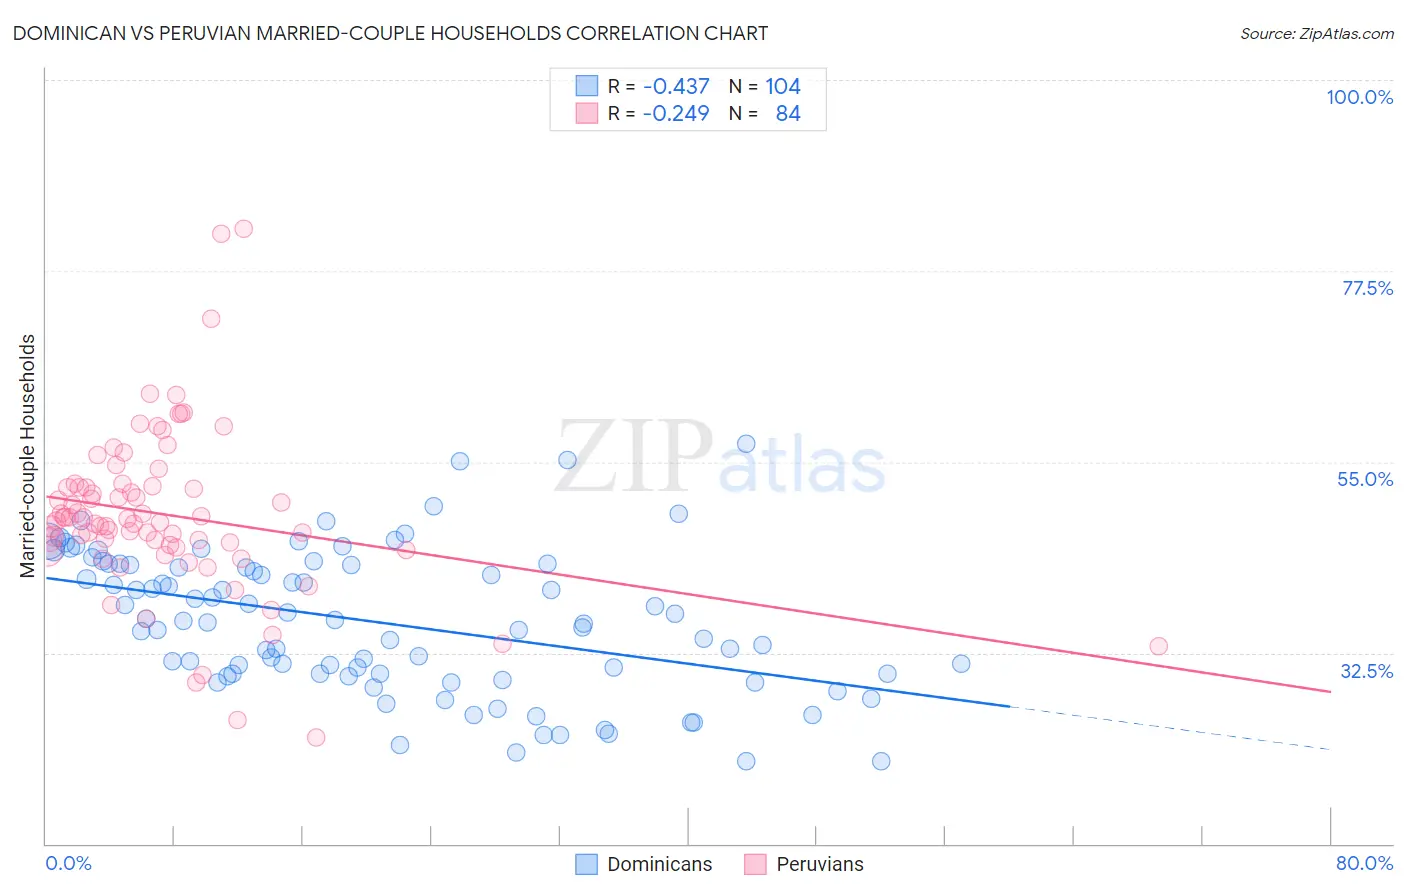
Dominican vs Peruvian Married-couple Households Correlation Chart
The statistical analysis conducted on geographies consisting of 354,744,310 people shows a moderate negative correlation between the proportion of Dominicans and percentage of married-couple family households in the United States with a correlation coefficient (R) of -0.437 and weighted average of 38.2%. Similarly, the statistical analysis conducted on geographies consisting of 362,959,523 people shows a weak negative correlation between the proportion of Peruvians and percentage of married-couple family households in the United States with a correlation coefficient (R) of -0.249 and weighted average of 47.6%, a difference of 24.8%.
Married-couple Households Correlation Summary
| Measurement | Dominican | Peruvian |
| Minimum | 19.7% | 22.6% |
| Maximum | 57.1% | 82.5% |
| Range | 37.4% | 60.0% |
| Mean | 36.1% | 48.8% |
| Median | 36.2% | 48.1% |
| Interquartile 25% (IQ1) | 30.0% | 45.0% |
| Interquartile 75% (IQ3) | 42.8% | 52.0% |
| Interquartile Range (IQR) | 12.8% | 7.0% |
| Standard Deviation (Sample) | 8.3% | 9.8% |
| Standard Deviation (Population) | 8.3% | 9.8% |
Similar Demographics by Married-couple Households
Demographics Similar to Dominicans by Married-couple Households
In terms of married-couple households, the demographic groups most similar to Dominicans are Cape Verdean (38.1%, a difference of 0.13%), British West Indian (38.3%, a difference of 0.38%), Immigrants from Senegal (38.4%, a difference of 0.50%), Immigrants from Somalia (38.4%, a difference of 0.66%), and Tohono O'odham (37.9%, a difference of 0.73%).
| Demographics | Rating | Rank | Married-couple Households |
| Immigrants | West Indies | 0.0 /100 | #333 | Tragic 39.0% |
| Immigrants | St. Vincent and the Grenadines | 0.0 /100 | #334 | Tragic 38.7% |
| Senegalese | 0.0 /100 | #335 | Tragic 38.6% |
| Blacks/African Americans | 0.0 /100 | #336 | Tragic 38.5% |
| Immigrants | Somalia | 0.0 /100 | #337 | Tragic 38.4% |
| Immigrants | Senegal | 0.0 /100 | #338 | Tragic 38.4% |
| British West Indians | 0.0 /100 | #339 | Tragic 38.3% |
| Dominicans | 0.0 /100 | #340 | Tragic 38.2% |
| Cape Verdeans | 0.0 /100 | #341 | Tragic 38.1% |
| Tohono O'odham | 0.0 /100 | #342 | Tragic 37.9% |
| Immigrants | Grenada | 0.0 /100 | #343 | Tragic 37.5% |
| Immigrants | Dominican Republic | 0.0 /100 | #344 | Tragic 37.3% |
| Hopi | 0.0 /100 | #345 | Tragic 36.7% |
| Immigrants | Cabo Verde | 0.0 /100 | #346 | Tragic 36.2% |
| Pima | 0.0 /100 | #347 | Tragic 35.6% |
Demographics Similar to Peruvians by Married-couple Households
In terms of married-couple households, the demographic groups most similar to Peruvians are Syrian (47.6%, a difference of 0.010%), Venezuelan (47.6%, a difference of 0.010%), Macedonian (47.6%, a difference of 0.020%), Immigrants from Europe (47.6%, a difference of 0.020%), and Immigrants from Jordan (47.7%, a difference of 0.040%).
| Demographics | Rating | Rank | Married-couple Households |
| Immigrants | Czechoslovakia | 95.5 /100 | #105 | Exceptional 47.8% |
| Portuguese | 95.5 /100 | #106 | Exceptional 47.8% |
| Estonians | 94.7 /100 | #107 | Exceptional 47.7% |
| Immigrants | Japan | 94.4 /100 | #108 | Exceptional 47.7% |
| Immigrants | Jordan | 94.1 /100 | #109 | Exceptional 47.7% |
| Macedonians | 93.9 /100 | #110 | Exceptional 47.6% |
| Syrians | 93.9 /100 | #111 | Exceptional 47.6% |
| Peruvians | 93.8 /100 | #112 | Exceptional 47.6% |
| Venezuelans | 93.8 /100 | #113 | Exceptional 47.6% |
| Immigrants | Europe | 93.7 /100 | #114 | Exceptional 47.6% |
| Slovaks | 92.9 /100 | #115 | Exceptional 47.6% |
| Argentineans | 92.5 /100 | #116 | Exceptional 47.5% |
| French Canadians | 92.4 /100 | #117 | Exceptional 47.5% |
| Immigrants | Germany | 92.4 /100 | #118 | Exceptional 47.5% |
| Chileans | 92.2 /100 | #119 | Exceptional 47.5% |