Delaware vs Subsaharan African Seniors Poverty Over the Age of 75

COMPARE

Delaware
Race
Ancestry
AfghanAfricanAlaska NativeAlaskan AthabascanAlbanianAleutAlsatianAmericanApacheArabArapahoArgentineanArmenianAssyrian/Chaldean/SyriacAustralianAustrianBahamianBangladeshiBarbadianBasqueBelgianBelizeanBermudanBhutaneseBlackfeetBolivianBrazilianBritishBritish West IndianBulgarianBurmeseCajunCambodianCanadianCape VerdeanCarpatho RusynCelticCentral AmericanCentral American IndianCherokeeCheyenneChickasawChileanChineseChippewaChoctawColombianColvilleComancheCosta RicanCreeCreekCroatianCrowCubanCypriotCzechCzechoslovakianDanishDelawareDominicanDutchDutch West IndianEastern EuropeanEcuadorianEgyptianEnglishEstonianEthiopianEuropeanFijianFilipinoFinnishFrenchFrench American IndianFrench CanadianGermanGerman RussianGhanaianGreekGuamanian/ChamorroGuatemalanGuyaneseHaitianHmongHonduranHopiHoumaHungarianIcelanderIndian (Asian)IndonesianInupiatIranianIraqiIrishIroquoisIsraeliItalianJamaicanJapaneseJordanianKenyanKiowaKoreanLaotianLatvianLebaneseLiberianLithuanianLumbeeLuxembourgerMacedonianMalaysianMalteseMarshalleseMenomineeMexicanMexican American IndianMongolianMoroccanNative HawaiianNavajoNepaleseNew ZealanderNicaraguanNigerianNorthern EuropeanNorwegianOkinawanOsageOttawaPaiutePakistaniPalestinianPanamanianParaguayanPennsylvania GermanPeruvianPimaPolishPortuguesePotawatomiPuebloPuerto RicanPuget Sound SalishRomanianRussianSalvadoranSamoanScandinavianScotch-IrishScottishSeminoleSenegaleseSerbianShoshoneSierra LeoneanSiouxSlavicSlovakSloveneSomaliSouth AfricanSouth AmericanSouth American IndianSoviet UnionSpaniardSpanishSpanish AmericanSpanish American IndianSri LankanSudaneseSwedishSwissSyrianTaiwaneseThaiTlingit-HaidaTohono O'OdhamTonganTrinidadian and TobagonianTsimshianTurkishU.S. Virgin IslanderUgandanUkrainianUruguayanUteVenezuelanVietnameseWelshWest IndianYakamaYaquiYugoslavianYumanYup'ikZimbabwean
Immigration
NonimmigrantsImmigrantsAfghanistanAfricaAlbaniaArgentinaArmeniaAsiaAustraliaAustriaBahamasBangladeshBarbadosBelarusBelgiumBelizeBoliviaBosnia and HerzegovinaBrazilBulgariaBurma/MyanmarCabo VerdeCambodiaCameroonCanadaCaribbeanCentral AmericaChileChinaColombiaCongoCosta RicaCroatiaCubaCzechoslovakiaDenmarkDominicaDominican RepublicEastern AfricaEastern AsiaEastern EuropeEcuadorEgyptEl SalvadorEnglandEritreaEthiopiaEuropeFijiFranceGermanyGhanaGreeceGrenadaGuatemalaGuyanaHaitiHondurasHong KongHungaryIndiaIndonesiaIranIraqIrelandIsraelItalyJamaicaJapanJordanKazakhstanKenyaKoreaKuwaitLaosLatin AmericaLatviaLebanonLiberiaLithuaniaMalaysiaMexicoMicronesiaMiddle AfricaMoldovaMoroccoNepalNetherlandsNicaraguaNigeriaNorth AmericaNorth MacedoniaNorthern AfricaNorthern EuropeNorwayOceaniaPakistanPanamaPeruPhilippinesPolandPortugalRomaniaRussiaSaudi ArabiaScotlandSenegalSerbiaSierra LeoneSingaporeSomaliaSouth AfricaSouth AmericaSouth Central AsiaSouth Eastern AsiaSouthern EuropeSpainSri LankaSt. Vincent and the GrenadinesSudanSwedenSwitzerlandSyriaTaiwanThailandTrinidad and TobagoTurkeyUgandaUkraineUruguayUzbekistanVenezuelaVietnamWest IndiesWestern AfricaWestern AsiaWestern EuropeYemenZaireZimbabweAzores
Subsaharan African
Race
Ancestry
AfghanAfricanAlaska NativeAlaskan AthabascanAlbanianAleutAlsatianAmericanApacheArabArapahoArgentineanArmenianAssyrian/Chaldean/SyriacAustralianAustrianBahamianBangladeshiBarbadianBasqueBelgianBelizeanBermudanBhutaneseBlackfeetBolivianBrazilianBritishBritish West IndianBulgarianBurmeseCajunCambodianCanadianCape VerdeanCarpatho RusynCelticCentral AmericanCentral American IndianCherokeeCheyenneChickasawChileanChineseChippewaChoctawColombianColvilleComancheCosta RicanCreeCreekCroatianCrowCubanCypriotCzechCzechoslovakianDanishDominicanDutchDutch West IndianEastern EuropeanEcuadorianEgyptianEnglishEstonianEthiopianEuropeanFijianFilipinoFinnishFrenchFrench American IndianFrench CanadianGermanGerman RussianGhanaianGreekGuamanian/ChamorroGuatemalanGuyaneseHaitianHmongHonduranHopiHoumaHungarianIcelanderIndian (Asian)IndonesianInupiatIranianIraqiIrishIroquoisIsraeliItalianJamaicanJapaneseJordanianKenyanKiowaKoreanLaotianLatvianLebaneseLiberianLithuanianLumbeeLuxembourgerMacedonianMalaysianMalteseMarshalleseMenomineeMexicanMexican American IndianMongolianMoroccanNative HawaiianNavajoNepaleseNew ZealanderNicaraguanNigerianNorthern EuropeanNorwegianOkinawanOsageOttawaPaiutePakistaniPalestinianPanamanianParaguayanPennsylvania GermanPeruvianPimaPolishPortuguesePotawatomiPuebloPuerto RicanPuget Sound SalishRomanianRussianSalvadoranSamoanScandinavianScotch-IrishScottishSeminoleSenegaleseSerbianShoshoneSierra LeoneanSiouxSlavicSlovakSloveneSomaliSouth AfricanSouth AmericanSouth American IndianSoviet UnionSpaniardSpanishSpanish AmericanSpanish American IndianSri LankanSubsaharan AfricanSudaneseSwedishSwissSyrianTaiwaneseThaiTlingit-HaidaTohono O'OdhamTonganTrinidadian and TobagonianTsimshianTurkishU.S. Virgin IslanderUgandanUkrainianUruguayanUteVenezuelanVietnameseWelshWest IndianYakamaYaquiYugoslavianYumanYup'ikZimbabwean
Immigration
NonimmigrantsImmigrantsAfghanistanAfricaAlbaniaArgentinaArmeniaAsiaAustraliaAustriaBahamasBangladeshBarbadosBelarusBelgiumBelizeBoliviaBosnia and HerzegovinaBrazilBulgariaBurma/MyanmarCabo VerdeCambodiaCameroonCanadaCaribbeanCentral AmericaChileChinaColombiaCongoCosta RicaCroatiaCubaCzechoslovakiaDenmarkDominicaDominican RepublicEastern AfricaEastern AsiaEastern EuropeEcuadorEgyptEl SalvadorEnglandEritreaEthiopiaEuropeFijiFranceGermanyGhanaGreeceGrenadaGuatemalaGuyanaHaitiHondurasHong KongHungaryIndiaIndonesiaIranIraqIrelandIsraelItalyJamaicaJapanJordanKazakhstanKenyaKoreaKuwaitLaosLatin AmericaLatviaLebanonLiberiaLithuaniaMalaysiaMexicoMicronesiaMiddle AfricaMoldovaMoroccoNepalNetherlandsNicaraguaNigeriaNorth AmericaNorth MacedoniaNorthern AfricaNorthern EuropeNorwayOceaniaPakistanPanamaPeruPhilippinesPolandPortugalRomaniaRussiaSaudi ArabiaScotlandSenegalSerbiaSierra LeoneSingaporeSomaliaSouth AfricaSouth AmericaSouth Central AsiaSouth Eastern AsiaSouthern EuropeSpainSri LankaSt. Vincent and the GrenadinesSudanSwedenSwitzerlandSyriaTaiwanThailandTrinidad and TobagoTurkeyUgandaUkraineUruguayUzbekistanVenezuelaVietnamWest IndiesWestern AfricaWestern AsiaWestern EuropeYemenZaireZimbabweAzores
Seniors Poverty Over the Age of 75
Income
Poverty
Unemployment
Labor Participation
Family Structure
Vehicle Availability
Education Level
Disability

Seniors Poverty Over the Age of 75 Comparison

Delaware

Sub-Saharan Africans

Exceptional
Tragic
11.4%
SENIORS POVERTY OVER THE AGE OF 75
96.0/ 100
METRIC RATING
74th/ 347
METRIC RANK
13.2%
SENIORS POVERTY OVER THE AGE OF 75
1.5/ 100
METRIC RATING
231st/ 347
METRIC RANK

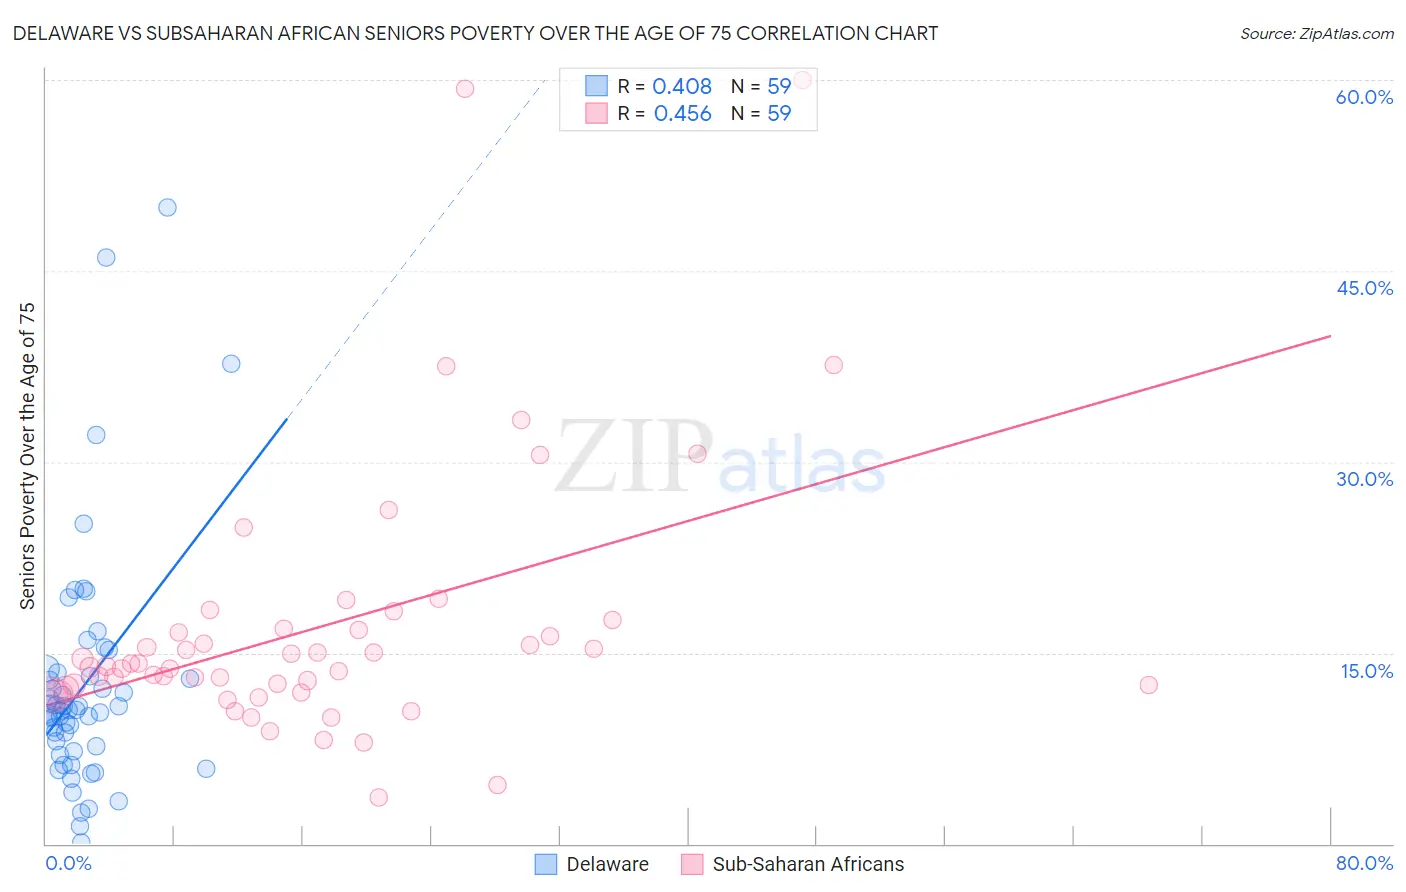
Delaware vs Subsaharan African Seniors Poverty Over the Age of 75 Correlation Chart

The statistical analysis conducted on geographies consisting of 95,641,420 people shows a moderate positive correlation between the proportion of Delaware and poverty level among seniors over the age of 75 in the United States with a correlation coefficient (R) of 0.408 and weighted average of 11.4%. Similarly, the statistical analysis conducted on geographies consisting of 499,481,078 people shows a moderate positive correlation between the proportion of Sub-Saharan Africans and poverty level among seniors over the age of 75 in the United States with a correlation coefficient (R) of 0.456 and weighted average of 13.2%, a difference of 16.0%.
Delaware vs Subsaharan African Seniors Poverty Over the Age of 75

Seniors Poverty Over the Age of 75 Correlation Summary

MeasurementDelawareSubsaharan African
Minimum0.12%3.6%
Maximum50.0%60.0%
Range49.9%56.4%
Mean12.5%17.1%
Median10.5%13.9%
Interquartile 25% (IQ1)7.2%12.2%
Interquartile 75% (IQ3)13.5%16.9%
Interquartile Range (IQR)6.2%4.7%
Standard Deviation (Sample)9.4%10.6%
Standard Deviation (Population)9.3%10.5%

Similar Demographics by Seniors Poverty Over the Age of 75

Demographics Similar to Delaware by Seniors Poverty Over the Age of 75

In terms of seniors poverty over the age of 75, the demographic groups most similar to Delaware are Immigrants from Micronesia (11.4%, a difference of 0.010%), Sierra Leonean (11.4%, a difference of 0.10%), Palestinian (11.4%, a difference of 0.10%), French Canadian (11.4%, a difference of 0.16%), and Osage (11.4%, a difference of 0.20%).
DemographicsRating | RankSeniors Poverty Over the Age of 75
Bolivians
96.5
/100
|
#67
Exceptional
11.4%
Immigrants | Austria
96.5
/100
|
#68
Exceptional
11.4%
Ottawa
96.5
/100
|
#69
Exceptional
11.4%
Immigrants | South Central Asia
96.4
/100
|
#70
Exceptional
11.4%
Osage
96.3
/100
|
#71
Exceptional
11.4%
Sierra Leoneans
96.1
/100
|
#72
Exceptional
11.4%
Immigrants | Micronesia
96.0
/100
|
#73
Exceptional
11.4%
Delaware
96.0
/100
|
#74
Exceptional
11.4%
Palestinians
95.8
/100
|
#75
Exceptional
11.4%
French Canadians
95.7
/100
|
#76
Exceptional
11.4%
Whites/Caucasians
95.5
/100
|
#77
Exceptional
11.4%
Macedonians
95.5
/100
|
#78
Exceptional
11.4%
Filipinos
95.5
/100
|
#79
Exceptional
11.4%
Alaska Natives
95.4
/100
|
#80
Exceptional
11.4%
Basques
95.1
/100
|
#81
Exceptional
11.5%

Demographics Similar to Sub-Saharan Africans by Seniors Poverty Over the Age of 75

In terms of seniors poverty over the age of 75, the demographic groups most similar to Sub-Saharan Africans are Immigrants from China (13.2%, a difference of 0.010%), Somali (13.2%, a difference of 0.090%), Immigrants from Chile (13.3%, a difference of 0.20%), Immigrants from Costa Rica (13.3%, a difference of 0.23%), and Israeli (13.2%, a difference of 0.53%).
DemographicsRating | RankSeniors Poverty Over the Age of 75
Chippewa
2.9
/100
|
#224
Tragic
13.1%
Immigrants | Morocco
2.8
/100
|
#225
Tragic
13.1%
Shoshone
2.6
/100
|
#226
Tragic
13.1%
Cree
2.3
/100
|
#227
Tragic
13.1%
Israelis
2.0
/100
|
#228
Tragic
13.2%
Somalis
1.6
/100
|
#229
Tragic
13.2%
Immigrants | China
1.5
/100
|
#230
Tragic
13.2%
Sub-Saharan Africans
1.5
/100
|
#231
Tragic
13.2%
Immigrants | Chile
1.3
/100
|
#232
Tragic
13.3%
Immigrants | Costa Rica
1.3
/100
|
#233
Tragic
13.3%
Immigrants | Israel
1.1
/100
|
#234
Tragic
13.3%
Japanese
0.9
/100
|
#235
Tragic
13.3%
Moroccans
0.9
/100
|
#236
Tragic
13.3%
Alaskan Athabascans
0.8
/100
|
#237
Tragic
13.4%
Peruvians
0.8
/100
|
#238
Tragic
13.4%