Immigrants from Venezuela vs Portuguese Births to Unmarried Women
COMPARE
Immigrants from Venezuela
Portuguese
Births to Unmarried Women
Births to Unmarried Women Comparison
Immigrants from Venezuela
Portuguese
31.7%
BIRTHS TO UNMARRIED WOMEN
49.2/ 100
METRIC RATING
175th/ 347
METRIC RANK
33.8%
BIRTHS TO UNMARRIED WOMEN
5.4/ 100
METRIC RATING
220th/ 347
METRIC RANK
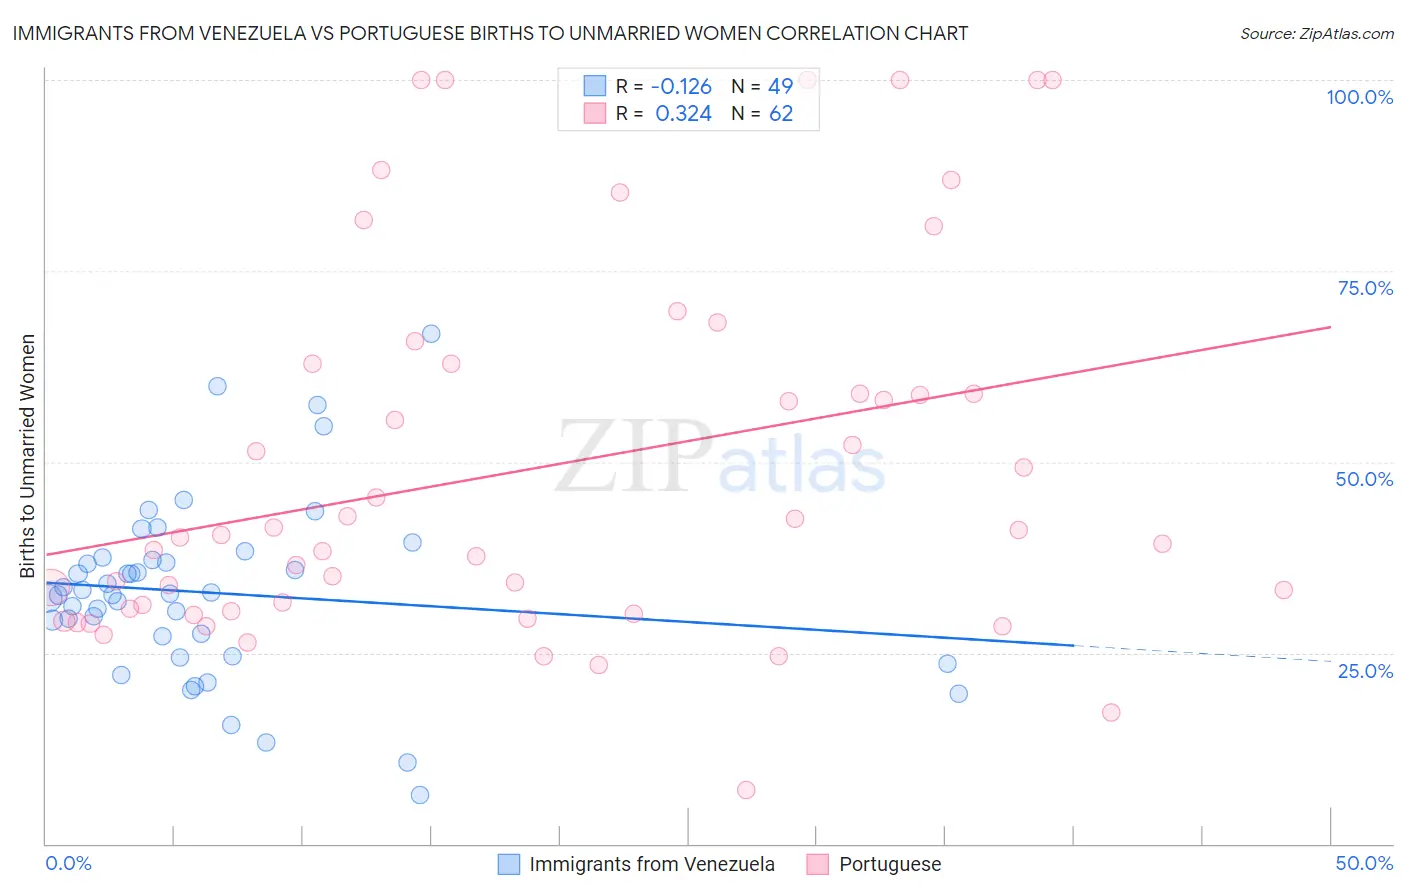
Immigrants from Venezuela vs Portuguese Births to Unmarried Women Correlation Chart
The statistical analysis conducted on geographies consisting of 274,329,219 people shows a poor negative correlation between the proportion of Immigrants from Venezuela and percentage of births to unmarried women in the United States with a correlation coefficient (R) of -0.126 and weighted average of 31.7%. Similarly, the statistical analysis conducted on geographies consisting of 413,543,833 people shows a mild positive correlation between the proportion of Portuguese and percentage of births to unmarried women in the United States with a correlation coefficient (R) of 0.324 and weighted average of 33.8%, a difference of 6.7%.
Births to Unmarried Women Correlation Summary
| Measurement | Immigrants from Venezuela | Portuguese |
| Minimum | 6.4% | 7.1% |
| Maximum | 66.7% | 100.0% |
| Range | 60.3% | 92.9% |
| Mean | 32.9% | 49.2% |
| Median | 32.8% | 40.3% |
| Interquartile 25% (IQ1) | 25.9% | 30.5% |
| Interquartile 75% (IQ3) | 37.3% | 62.8% |
| Interquartile Range (IQR) | 11.4% | 32.3% |
| Standard Deviation (Sample) | 11.7% | 24.4% |
| Standard Deviation (Population) | 11.6% | 24.2% |
Similar Demographics by Births to Unmarried Women
Demographics Similar to Immigrants from Venezuela by Births to Unmarried Women
In terms of births to unmarried women, the demographic groups most similar to Immigrants from Venezuela are Venezuelan (31.7%, a difference of 0.080%), Immigrants from Yemen (31.7%, a difference of 0.10%), Scottish (31.7%, a difference of 0.10%), Finnish (31.7%, a difference of 0.12%), and Immigrants from Eritrea (31.7%, a difference of 0.12%).
| Demographics | Rating | Rank | Births to Unmarried Women |
| Belgians | 52.4 /100 | #168 | Average 31.6% |
| Slavs | 52.0 /100 | #169 | Average 31.6% |
| Guamanians/Chamorros | 51.3 /100 | #170 | Average 31.6% |
| Finns | 50.5 /100 | #171 | Average 31.7% |
| Immigrants | Eritrea | 50.4 /100 | #172 | Average 31.7% |
| Immigrants | Yemen | 50.2 /100 | #173 | Average 31.7% |
| Venezuelans | 50.0 /100 | #174 | Average 31.7% |
| Immigrants | Venezuela | 49.2 /100 | #175 | Average 31.7% |
| Scottish | 48.1 /100 | #176 | Average 31.7% |
| South American Indians | 47.7 /100 | #177 | Average 31.7% |
| English | 47.4 /100 | #178 | Average 31.7% |
| South Americans | 46.9 /100 | #179 | Average 31.8% |
| Moroccans | 45.7 /100 | #180 | Average 31.8% |
| Immigrants | Peru | 45.1 /100 | #181 | Average 31.8% |
| Kenyans | 43.0 /100 | #182 | Average 31.9% |
Demographics Similar to Portuguese by Births to Unmarried Women
In terms of births to unmarried women, the demographic groups most similar to Portuguese are Alsatian (33.8%, a difference of 0.020%), Malaysian (33.9%, a difference of 0.17%), Immigrants from Ecuador (33.7%, a difference of 0.24%), Immigrants from Uruguay (33.9%, a difference of 0.24%), and Pennsylvania German (34.0%, a difference of 0.53%).
| Demographics | Rating | Rank | Births to Unmarried Women |
| Immigrants | Costa Rica | 9.5 /100 | #213 | Tragic 33.4% |
| Slovaks | 9.3 /100 | #214 | Tragic 33.4% |
| French | 8.7 /100 | #215 | Tragic 33.4% |
| Nepalese | 7.8 /100 | #216 | Tragic 33.5% |
| Spaniards | 7.0 /100 | #217 | Tragic 33.6% |
| Immigrants | Ecuador | 5.9 /100 | #218 | Tragic 33.7% |
| Alsatians | 5.4 /100 | #219 | Tragic 33.8% |
| Portuguese | 5.4 /100 | #220 | Tragic 33.8% |
| Malaysians | 5.0 /100 | #221 | Tragic 33.9% |
| Immigrants | Uruguay | 4.8 /100 | #222 | Tragic 33.9% |
| Pennsylvania Germans | 4.3 /100 | #223 | Tragic 34.0% |
| Immigrants | Laos | 4.3 /100 | #224 | Tragic 34.0% |
| Spanish | 4.0 /100 | #225 | Tragic 34.1% |
| Delaware | 3.3 /100 | #226 | Tragic 34.2% |
| Immigrants | Panama | 3.3 /100 | #227 | Tragic 34.2% |