Immigrants from Middle Africa vs Portuguese Births to Unmarried Women
COMPARE
Immigrants from Middle Africa
Portuguese
Births to Unmarried Women
Births to Unmarried Women Comparison
Immigrants from Middle Africa
Portuguese
34.9%
BIRTHS TO UNMARRIED WOMEN
1.2/ 100
METRIC RATING
240th/ 347
METRIC RANK
33.8%
BIRTHS TO UNMARRIED WOMEN
5.4/ 100
METRIC RATING
220th/ 347
METRIC RANK
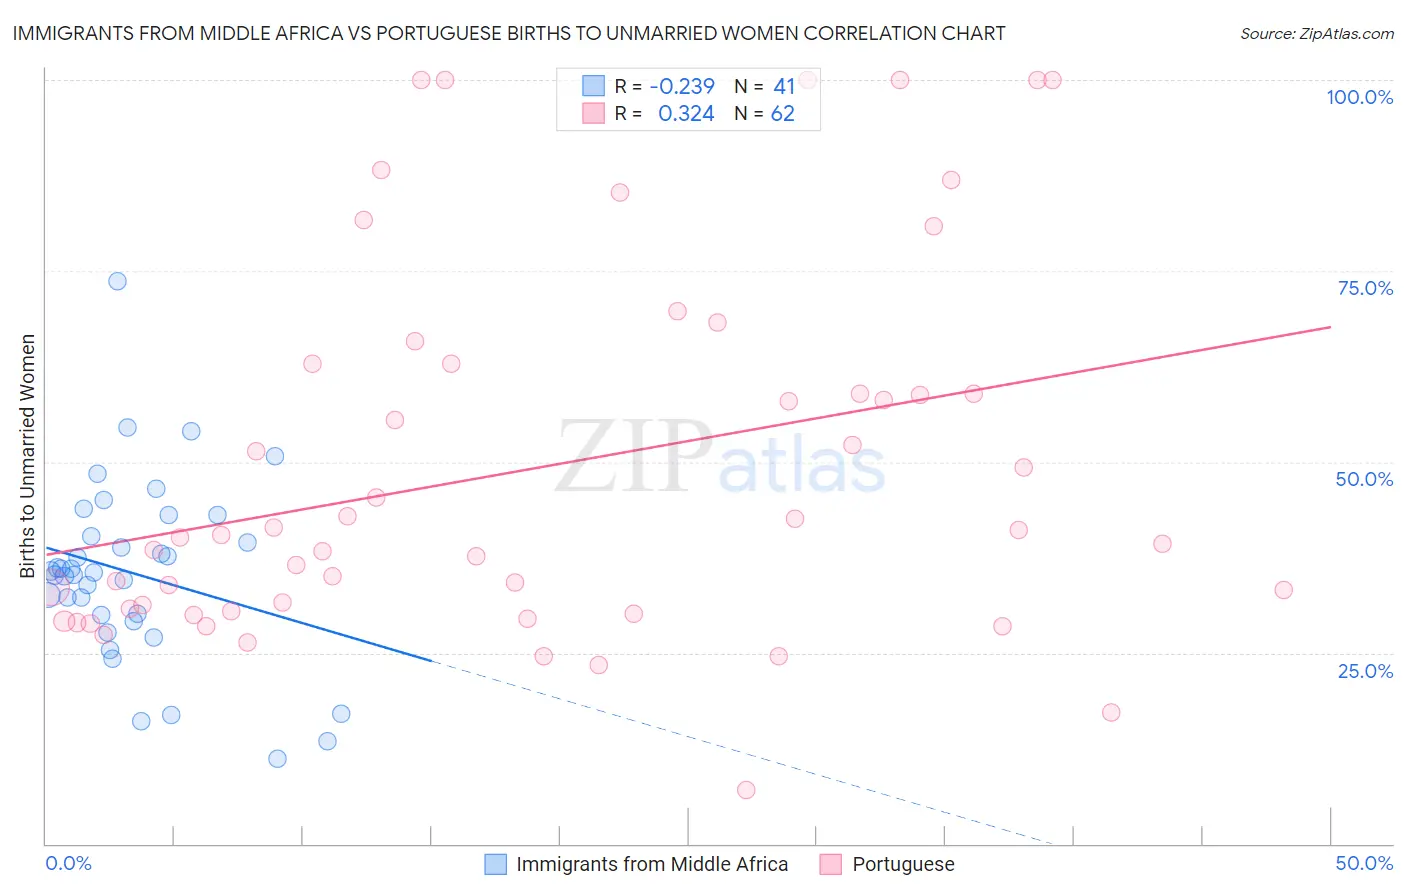
Immigrants from Middle Africa vs Portuguese Births to Unmarried Women Correlation Chart
The statistical analysis conducted on geographies consisting of 197,160,822 people shows a weak negative correlation between the proportion of Immigrants from Middle Africa and percentage of births to unmarried women in the United States with a correlation coefficient (R) of -0.239 and weighted average of 34.9%. Similarly, the statistical analysis conducted on geographies consisting of 413,543,833 people shows a mild positive correlation between the proportion of Portuguese and percentage of births to unmarried women in the United States with a correlation coefficient (R) of 0.324 and weighted average of 33.8%, a difference of 3.3%.
Births to Unmarried Women Correlation Summary
| Measurement | Immigrants from Middle Africa | Portuguese |
| Minimum | 11.1% | 7.1% |
| Maximum | 73.7% | 100.0% |
| Range | 62.6% | 92.9% |
| Mean | 35.4% | 49.2% |
| Median | 35.4% | 40.3% |
| Interquartile 25% (IQ1) | 29.5% | 30.5% |
| Interquartile 75% (IQ3) | 41.6% | 62.8% |
| Interquartile Range (IQR) | 12.1% | 32.3% |
| Standard Deviation (Sample) | 11.9% | 24.4% |
| Standard Deviation (Population) | 11.8% | 24.2% |
Demographics Similar to Immigrants from Middle Africa and Portuguese by Births to Unmarried Women
In terms of births to unmarried women, the demographic groups most similar to Immigrants from Middle Africa are Sierra Leonean (34.9%, a difference of 0.25%), Immigrants from Cambodia (34.8%, a difference of 0.47%), Marshallese (34.8%, a difference of 0.53%), Immigrants from Cameroon (34.7%, a difference of 0.61%), and Immigrants from Ghana (34.5%, a difference of 1.2%). Similarly, the demographic groups most similar to Portuguese are Malaysian (33.9%, a difference of 0.17%), Immigrants from Uruguay (33.9%, a difference of 0.24%), Pennsylvania German (34.0%, a difference of 0.53%), Immigrants from Laos (34.0%, a difference of 0.53%), and Spanish (34.1%, a difference of 0.70%).
| Demographics | Rating | Rank | Births to Unmarried Women |
| Portuguese | 5.4 /100 | #220 | Tragic 33.8% |
| Malaysians | 5.0 /100 | #221 | Tragic 33.9% |
| Immigrants | Uruguay | 4.8 /100 | #222 | Tragic 33.9% |
| Pennsylvania Germans | 4.3 /100 | #223 | Tragic 34.0% |
| Immigrants | Laos | 4.3 /100 | #224 | Tragic 34.0% |
| Spanish | 4.0 /100 | #225 | Tragic 34.1% |
| Delaware | 3.3 /100 | #226 | Tragic 34.2% |
| Immigrants | Panama | 3.3 /100 | #227 | Tragic 34.2% |
| Panamanians | 3.3 /100 | #228 | Tragic 34.2% |
| Immigrants | Sierra Leone | 3.1 /100 | #229 | Tragic 34.2% |
| Ghanaians | 3.1 /100 | #230 | Tragic 34.3% |
| Native Hawaiians | 2.9 /100 | #231 | Tragic 34.3% |
| French Canadians | 2.5 /100 | #232 | Tragic 34.4% |
| Bangladeshis | 2.5 /100 | #233 | Tragic 34.4% |
| Immigrants | Zaire | 2.3 /100 | #234 | Tragic 34.5% |
| Immigrants | Ghana | 2.2 /100 | #235 | Tragic 34.5% |
| Immigrants | Cameroon | 1.6 /100 | #236 | Tragic 34.7% |
| Marshallese | 1.6 /100 | #237 | Tragic 34.8% |
| Immigrants | Cambodia | 1.6 /100 | #238 | Tragic 34.8% |
| Sierra Leoneans | 1.4 /100 | #239 | Tragic 34.9% |
| Immigrants | Middle Africa | 1.2 /100 | #240 | Tragic 34.9% |