Delaware vs Portuguese In Labor Force | Age > 16
COMPARE
Delaware
Portuguese
In Labor Force | Age > 16
In Labor Force | Age > 16 Comparison
Delaware
Portuguese
63.6%
IN LABOR FORCE | AGE > 16
0.0/ 100
METRIC RATING
302nd/ 347
METRIC RANK
64.4%
IN LABOR FORCE | AGE > 16
1.6/ 100
METRIC RATING
251st/ 347
METRIC RANK
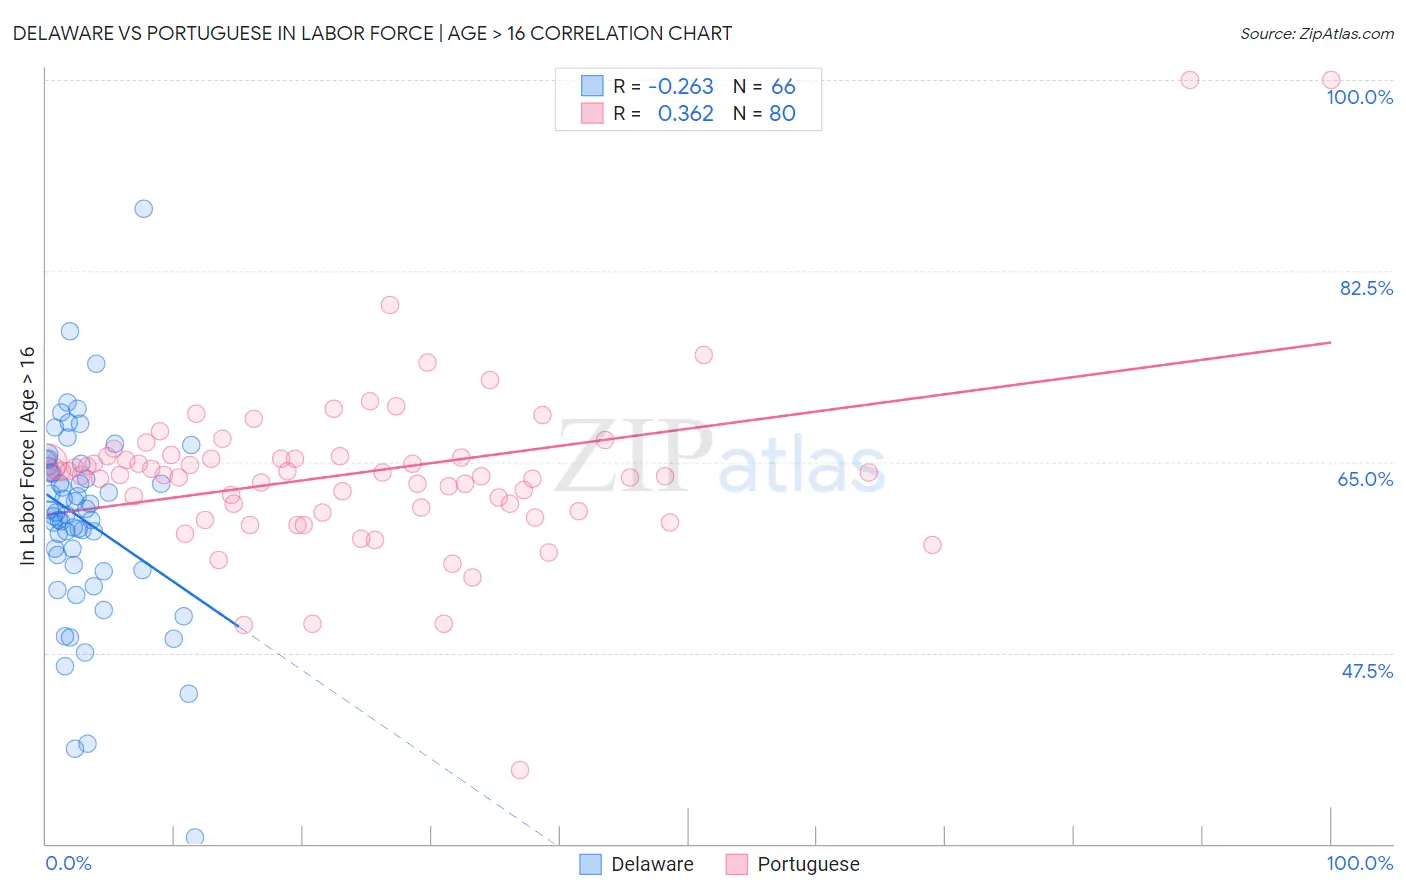
Delaware vs Portuguese In Labor Force | Age > 16 Correlation Chart
The statistical analysis conducted on geographies consisting of 96,240,371 people shows a weak negative correlation between the proportion of Delaware and labor force participation rate among population ages 16 and over in the United States with a correlation coefficient (R) of -0.263 and weighted average of 63.6%. Similarly, the statistical analysis conducted on geographies consisting of 450,362,243 people shows a mild positive correlation between the proportion of Portuguese and labor force participation rate among population ages 16 and over in the United States with a correlation coefficient (R) of 0.362 and weighted average of 64.4%, a difference of 1.3%.
In Labor Force | Age > 16 Correlation Summary
| Measurement | Delaware | Portuguese |
| Minimum | 30.6% | 36.8% |
| Maximum | 88.2% | 100.0% |
| Range | 57.6% | 63.2% |
| Mean | 59.7% | 64.0% |
| Median | 60.5% | 63.8% |
| Interquartile 25% (IQ1) | 55.6% | 60.7% |
| Interquartile 75% (IQ3) | 64.6% | 65.4% |
| Interquartile Range (IQR) | 9.0% | 4.8% |
| Standard Deviation (Sample) | 9.0% | 8.2% |
| Standard Deviation (Population) | 9.0% | 8.2% |
Similar Demographics by In Labor Force | Age > 16
Demographics Similar to Delaware by In Labor Force | Age > 16
In terms of in labor force | age > 16, the demographic groups most similar to Delaware are Spanish American (63.6%, a difference of 0.010%), Immigrants from the Azores (63.6%, a difference of 0.040%), Cree (63.5%, a difference of 0.040%), White/Caucasian (63.6%, a difference of 0.050%), and Nonimmigrants (63.5%, a difference of 0.090%).
| Demographics | Rating | Rank | In Labor Force | Age > 16 |
| Immigrants | Canada | 0.0 /100 | #295 | Tragic 63.7% |
| Immigrants | North America | 0.0 /100 | #296 | Tragic 63.7% |
| Immigrants | Grenada | 0.0 /100 | #297 | Tragic 63.6% |
| Comanche | 0.0 /100 | #298 | Tragic 63.6% |
| Whites/Caucasians | 0.0 /100 | #299 | Tragic 63.6% |
| Immigrants | Azores | 0.0 /100 | #300 | Tragic 63.6% |
| Spanish Americans | 0.0 /100 | #301 | Tragic 63.6% |
| Delaware | 0.0 /100 | #302 | Tragic 63.6% |
| Cree | 0.0 /100 | #303 | Tragic 63.5% |
| Immigrants | Nonimmigrants | 0.0 /100 | #304 | Tragic 63.5% |
| Osage | 0.0 /100 | #305 | Tragic 63.5% |
| Blacks/African Americans | 0.0 /100 | #306 | Tragic 63.4% |
| Central American Indians | 0.0 /100 | #307 | Tragic 63.4% |
| Pennsylvania Germans | 0.0 /100 | #308 | Tragic 63.4% |
| Scotch-Irish | 0.0 /100 | #309 | Tragic 63.3% |
Demographics Similar to Portuguese by In Labor Force | Age > 16
In terms of in labor force | age > 16, the demographic groups most similar to Portuguese are British West Indian (64.4%, a difference of 0.020%), German (64.4%, a difference of 0.030%), Immigrants from Dominican Republic (64.4%, a difference of 0.030%), Czechoslovakian (64.3%, a difference of 0.040%), and Immigrants from Uzbekistan (64.3%, a difference of 0.040%).
| Demographics | Rating | Rank | In Labor Force | Age > 16 |
| Tsimshian | 3.1 /100 | #244 | Tragic 64.5% |
| West Indians | 3.0 /100 | #245 | Tragic 64.5% |
| Immigrants | Caribbean | 2.3 /100 | #246 | Tragic 64.4% |
| Swiss | 2.1 /100 | #247 | Tragic 64.4% |
| Immigrants | Barbados | 2.1 /100 | #248 | Tragic 64.4% |
| Germans | 1.8 /100 | #249 | Tragic 64.4% |
| British West Indians | 1.8 /100 | #250 | Tragic 64.4% |
| Portuguese | 1.6 /100 | #251 | Tragic 64.4% |
| Immigrants | Dominican Republic | 1.5 /100 | #252 | Tragic 64.4% |
| Czechoslovakians | 1.4 /100 | #253 | Tragic 64.3% |
| Immigrants | Uzbekistan | 1.4 /100 | #254 | Tragic 64.3% |
| Hispanics or Latinos | 1.1 /100 | #255 | Tragic 64.3% |
| Immigrants | Mexico | 1.0 /100 | #256 | Tragic 64.3% |
| Inupiat | 0.8 /100 | #257 | Tragic 64.3% |
| Immigrants | Scotland | 0.8 /100 | #258 | Tragic 64.2% |