Delaware vs Macedonian Single Mother Households
COMPARE
Delaware
Macedonian
Single Mother Households
Single Mother Households Comparison
Delaware
Macedonians
6.5%
SINGLE MOTHER HOUSEHOLDS
23.3/ 100
METRIC RATING
189th/ 347
METRIC RANK
5.4%
SINGLE MOTHER HOUSEHOLDS
99.5/ 100
METRIC RATING
42nd/ 347
METRIC RANK
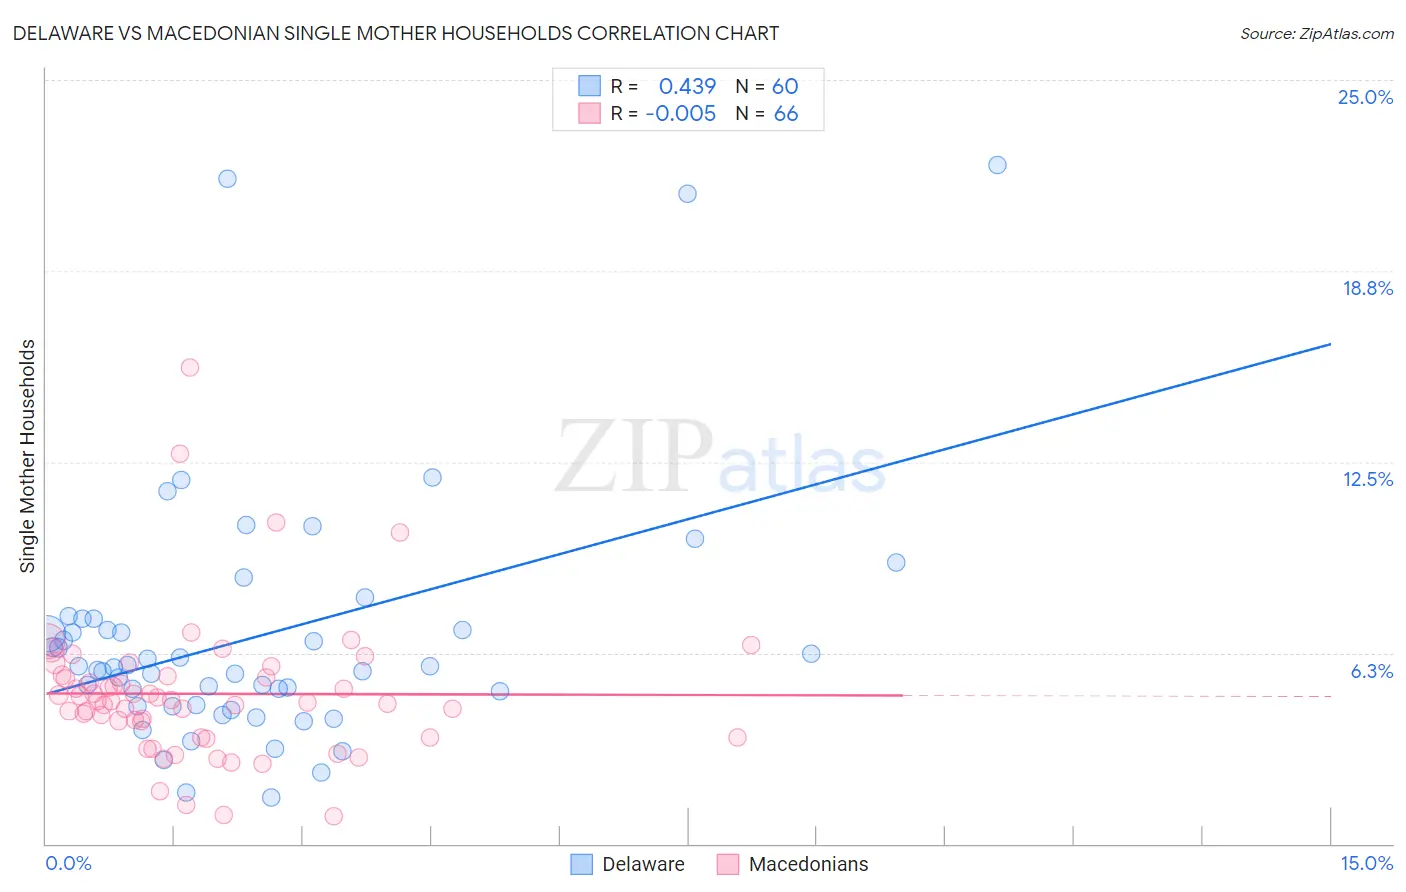
Delaware vs Macedonian Single Mother Households Correlation Chart
The statistical analysis conducted on geographies consisting of 96,147,855 people shows a moderate positive correlation between the proportion of Delaware and percentage of single mother households in the United States with a correlation coefficient (R) of 0.439 and weighted average of 6.5%. Similarly, the statistical analysis conducted on geographies consisting of 132,446,504 people shows no correlation between the proportion of Macedonians and percentage of single mother households in the United States with a correlation coefficient (R) of -0.005 and weighted average of 5.4%, a difference of 20.8%.
Single Mother Households Correlation Summary
| Measurement | Delaware | Macedonian |
| Minimum | 1.5% | 0.89% |
| Maximum | 22.2% | 15.6% |
| Range | 20.7% | 14.7% |
| Mean | 6.8% | 4.9% |
| Median | 5.8% | 4.7% |
| Interquartile 25% (IQ1) | 4.5% | 3.5% |
| Interquartile 75% (IQ3) | 7.2% | 5.5% |
| Interquartile Range (IQR) | 2.6% | 2.0% |
| Standard Deviation (Sample) | 4.2% | 2.4% |
| Standard Deviation (Population) | 4.1% | 2.4% |
Similar Demographics by Single Mother Households
Demographics Similar to Delaware by Single Mother Households
In terms of single mother households, the demographic groups most similar to Delaware are Ottawa (6.5%, a difference of 0.070%), Immigrants from Afghanistan (6.5%, a difference of 0.20%), Costa Rican (6.5%, a difference of 0.21%), Peruvian (6.5%, a difference of 0.26%), and Samoan (6.5%, a difference of 0.32%).
| Demographics | Rating | Rank | Single Mother Households |
| South American Indians | 33.4 /100 | #182 | Fair 6.4% |
| Spaniards | 27.8 /100 | #183 | Fair 6.5% |
| Ethiopians | 26.0 /100 | #184 | Fair 6.5% |
| Ugandans | 25.6 /100 | #185 | Fair 6.5% |
| Costa Ricans | 24.8 /100 | #186 | Fair 6.5% |
| Immigrants | Afghanistan | 24.7 /100 | #187 | Fair 6.5% |
| Ottawa | 23.8 /100 | #188 | Fair 6.5% |
| Delaware | 23.3 /100 | #189 | Fair 6.5% |
| Peruvians | 21.6 /100 | #190 | Fair 6.5% |
| Samoans | 21.2 /100 | #191 | Fair 6.5% |
| Americans | 19.0 /100 | #192 | Poor 6.6% |
| Colombians | 18.3 /100 | #193 | Poor 6.6% |
| Immigrants | Uganda | 18.3 /100 | #194 | Poor 6.6% |
| South Americans | 18.0 /100 | #195 | Poor 6.6% |
| Uruguayans | 18.0 /100 | #196 | Poor 6.6% |
Demographics Similar to Macedonians by Single Mother Households
In terms of single mother households, the demographic groups most similar to Macedonians are Immigrants from South Central Asia (5.4%, a difference of 0.060%), Immigrants from Greece (5.4%, a difference of 0.080%), Estonian (5.4%, a difference of 0.50%), Immigrants from Sweden (5.4%, a difference of 0.61%), and Immigrants from Serbia (5.4%, a difference of 0.76%).
| Demographics | Rating | Rank | Single Mother Households |
| Immigrants | Northern Europe | 99.7 /100 | #35 | Exceptional 5.3% |
| Immigrants | Czechoslovakia | 99.7 /100 | #36 | Exceptional 5.3% |
| Immigrants | Belgium | 99.7 /100 | #37 | Exceptional 5.3% |
| Immigrants | Serbia | 99.6 /100 | #38 | Exceptional 5.4% |
| Immigrants | Sweden | 99.6 /100 | #39 | Exceptional 5.4% |
| Estonians | 99.6 /100 | #40 | Exceptional 5.4% |
| Immigrants | Greece | 99.5 /100 | #41 | Exceptional 5.4% |
| Macedonians | 99.5 /100 | #42 | Exceptional 5.4% |
| Immigrants | South Central Asia | 99.5 /100 | #43 | Exceptional 5.4% |
| Lithuanians | 99.4 /100 | #44 | Exceptional 5.4% |
| Immigrants | Croatia | 99.4 /100 | #45 | Exceptional 5.4% |
| Croatians | 99.3 /100 | #46 | Exceptional 5.5% |
| Norwegians | 99.3 /100 | #47 | Exceptional 5.5% |
| Turks | 99.2 /100 | #48 | Exceptional 5.5% |
| Immigrants | Latvia | 99.2 /100 | #49 | Exceptional 5.5% |