Delaware vs Assyrian/Chaldean/Syriac Householder Income Under 25 years
COMPARE
Delaware
Assyrian/Chaldean/Syriac
Householder Income Under 25 years
Householder Income Under 25 years Comparison
Delaware
Assyrians/Chaldeans/Syriacs
$47,159
HOUSEHOLDER INCOME UNDER 25 YEARS
0.0/ 100
METRIC RATING
313th/ 347
METRIC RANK
$65,329
HOUSEHOLDER INCOME UNDER 25 YEARS
100.0/ 100
METRIC RATING
1st/ 347
METRIC RANK
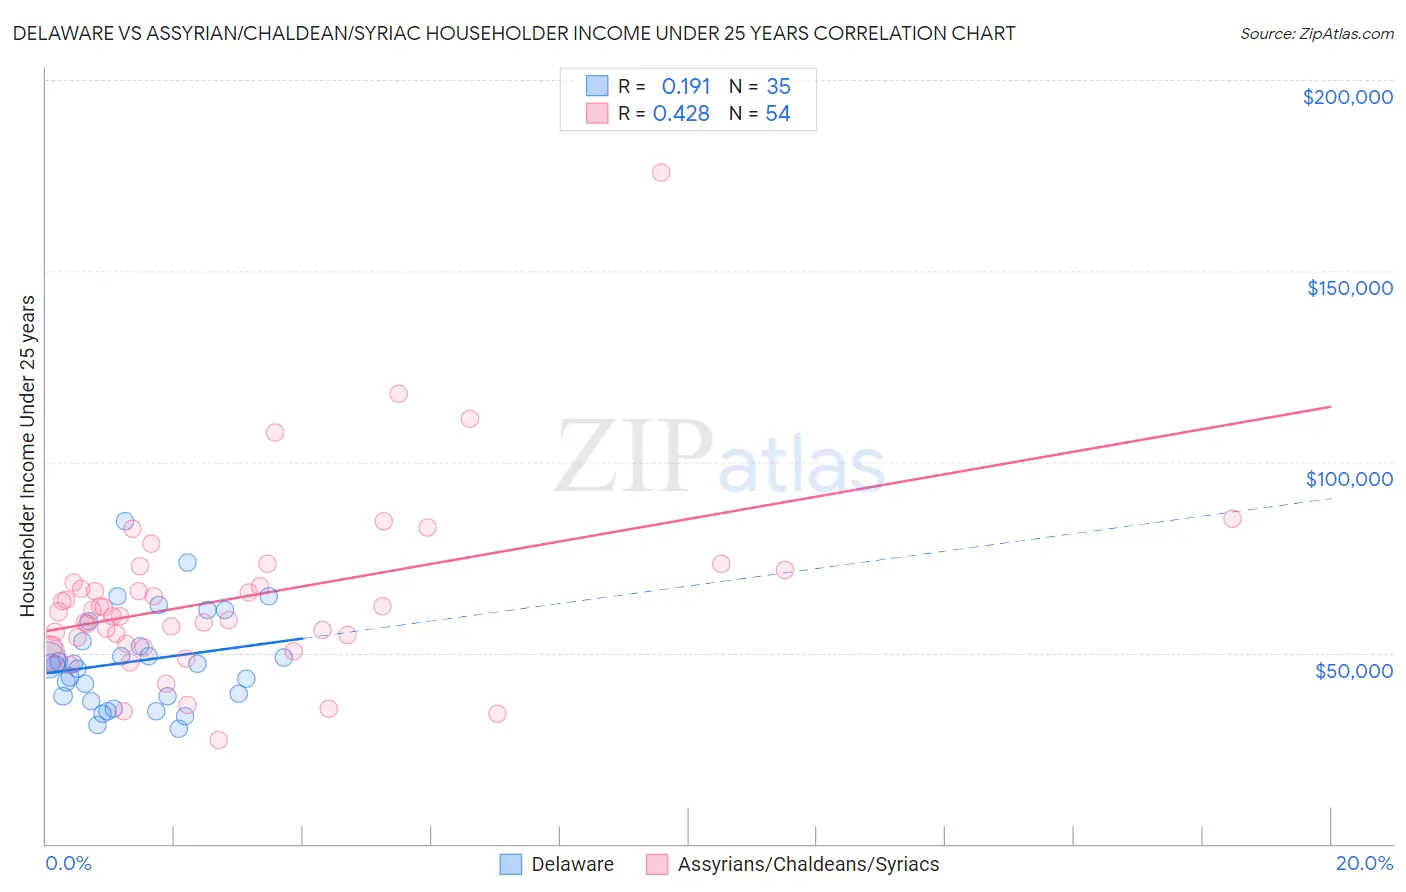
Delaware vs Assyrian/Chaldean/Syriac Householder Income Under 25 years Correlation Chart
The statistical analysis conducted on geographies consisting of 88,840,483 people shows a poor positive correlation between the proportion of Delaware and household income with householder under the age of 25 in the United States with a correlation coefficient (R) of 0.191 and weighted average of $47,159. Similarly, the statistical analysis conducted on geographies consisting of 100,770,753 people shows a moderate positive correlation between the proportion of Assyrians/Chaldeans/Syriacs and household income with householder under the age of 25 in the United States with a correlation coefficient (R) of 0.428 and weighted average of $65,329, a difference of 38.5%.
Householder Income Under 25 years Correlation Summary
| Measurement | Delaware | Assyrian/Chaldean/Syriac |
| Minimum | $30,000 | $27,045 |
| Maximum | $84,491 | $175,865 |
| Range | $54,491 | $148,820 |
| Mean | $47,740 | $64,201 |
| Median | $47,185 | $60,126 |
| Interquartile 25% (IQ1) | $38,611 | $52,453 |
| Interquartile 75% (IQ3) | $52,932 | $68,319 |
| Interquartile Range (IQR) | $14,321 | $15,866 |
| Standard Deviation (Sample) | $12,436 | $23,487 |
| Standard Deviation (Population) | $12,258 | $23,269 |
Similar Demographics by Householder Income Under 25 years
Demographics Similar to Delaware by Householder Income Under 25 years
In terms of householder income under 25 years, the demographic groups most similar to Delaware are Chippewa ($47,015, a difference of 0.31%), Crow ($47,012, a difference of 0.31%), Sudanese ($46,982, a difference of 0.38%), Hopi ($46,978, a difference of 0.39%), and Bermudan ($47,359, a difference of 0.43%).
| Demographics | Rating | Rank | Householder Income Under 25 years |
| Natives/Alaskans | 0.0 /100 | #306 | Tragic $47,704 |
| Bangladeshis | 0.0 /100 | #307 | Tragic $47,589 |
| Comanche | 0.0 /100 | #308 | Tragic $47,518 |
| U.S. Virgin Islanders | 0.0 /100 | #309 | Tragic $47,448 |
| Iroquois | 0.0 /100 | #310 | Tragic $47,380 |
| Ottawa | 0.0 /100 | #311 | Tragic $47,366 |
| Bermudans | 0.0 /100 | #312 | Tragic $47,359 |
| Delaware | 0.0 /100 | #313 | Tragic $47,159 |
| Chippewa | 0.0 /100 | #314 | Tragic $47,015 |
| Crow | 0.0 /100 | #315 | Tragic $47,012 |
| Sudanese | 0.0 /100 | #316 | Tragic $46,982 |
| Hopi | 0.0 /100 | #317 | Tragic $46,978 |
| Spanish Americans | 0.0 /100 | #318 | Tragic $46,913 |
| Africans | 0.0 /100 | #319 | Tragic $46,838 |
| Immigrants | Sudan | 0.0 /100 | #320 | Tragic $46,791 |
Demographics Similar to Assyrians/Chaldeans/Syriacs by Householder Income Under 25 years
In terms of householder income under 25 years, the demographic groups most similar to Assyrians/Chaldeans/Syriacs are Immigrants from Hong Kong ($62,083, a difference of 5.2%), Immigrants from India ($59,914, a difference of 9.0%), Immigrants from Taiwan ($59,424, a difference of 9.9%), Immigrants from Bolivia ($59,389, a difference of 10.0%), and Thai ($59,187, a difference of 10.4%).
| Demographics | Rating | Rank | Householder Income Under 25 years |
| Assyrians/Chaldeans/Syriacs | 100.0 /100 | #1 | Exceptional $65,329 |
| Immigrants | Hong Kong | 100.0 /100 | #2 | Exceptional $62,083 |
| Immigrants | India | 100.0 /100 | #3 | Exceptional $59,914 |
| Immigrants | Taiwan | 100.0 /100 | #4 | Exceptional $59,424 |
| Immigrants | Bolivia | 100.0 /100 | #5 | Exceptional $59,389 |
| Thais | 100.0 /100 | #6 | Exceptional $59,187 |
| Bolivians | 100.0 /100 | #7 | Exceptional $58,506 |
| Indians (Asian) | 100.0 /100 | #8 | Exceptional $58,239 |
| Chinese | 100.0 /100 | #9 | Exceptional $58,162 |
| Afghans | 100.0 /100 | #10 | Exceptional $58,019 |
| Immigrants | China | 100.0 /100 | #11 | Exceptional $57,931 |
| Immigrants | Philippines | 100.0 /100 | #12 | Exceptional $57,930 |
| Immigrants | South Central Asia | 100.0 /100 | #13 | Exceptional $57,818 |
| Filipinos | 100.0 /100 | #14 | Exceptional $57,740 |
| Koreans | 100.0 /100 | #15 | Exceptional $57,730 |