Danish vs European Single Father Households
COMPARE
Danish
European
Single Father Households
Single Father Households Comparison
Danes
Europeans
2.3%
SINGLE FATHER HOUSEHOLDS
48.2/ 100
METRIC RATING
176th/ 347
METRIC RANK
2.3%
SINGLE FATHER HOUSEHOLDS
80.9/ 100
METRIC RATING
155th/ 347
METRIC RANK
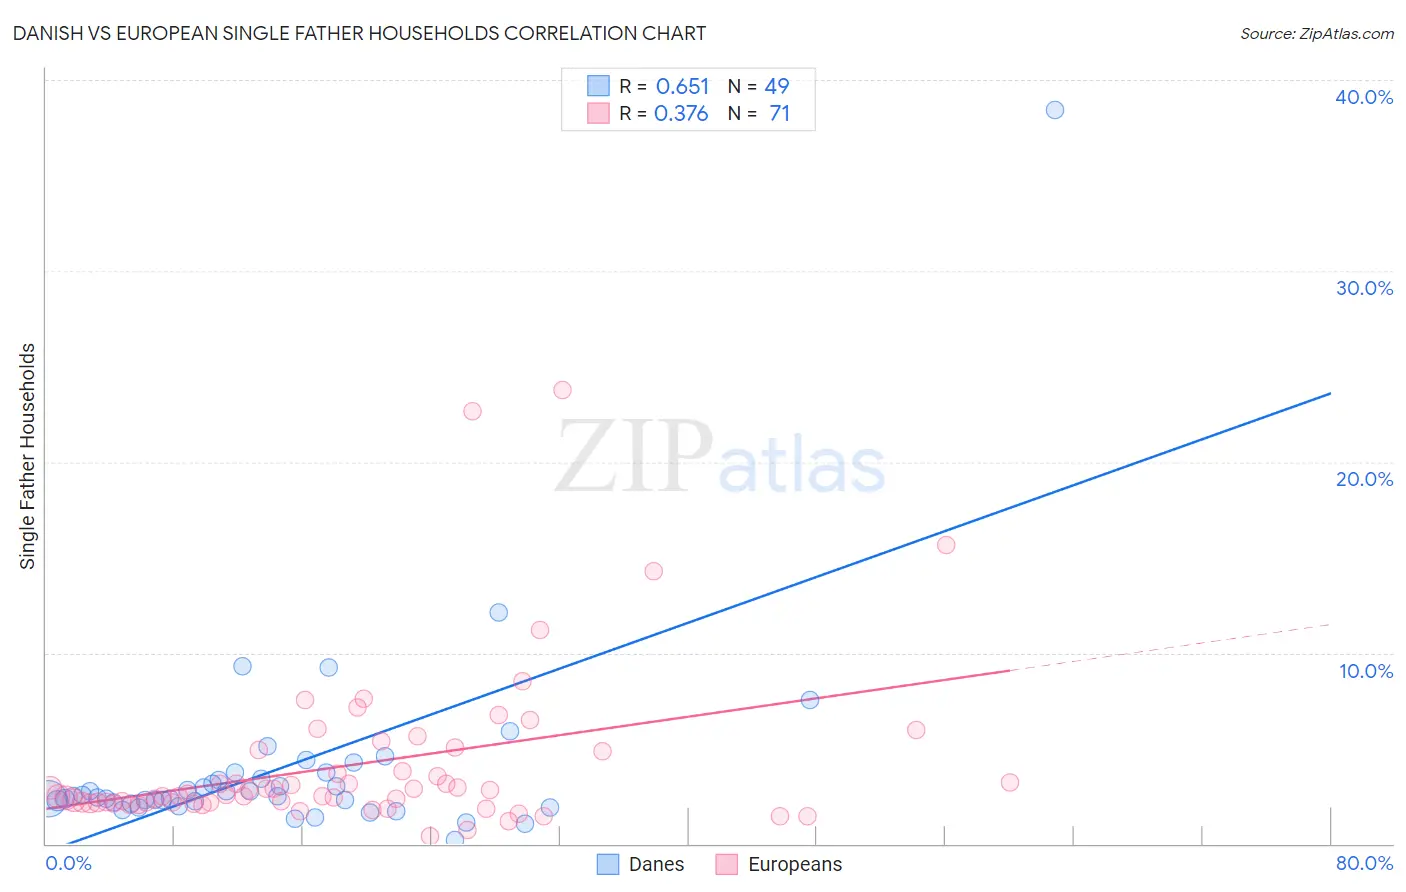
Danish vs European Single Father Households Correlation Chart
The statistical analysis conducted on geographies consisting of 466,880,679 people shows a significant positive correlation between the proportion of Danes and percentage of single father households in the United States with a correlation coefficient (R) of 0.651 and weighted average of 2.3%. Similarly, the statistical analysis conducted on geographies consisting of 548,404,075 people shows a mild positive correlation between the proportion of Europeans and percentage of single father households in the United States with a correlation coefficient (R) of 0.376 and weighted average of 2.3%, a difference of 2.9%.
Single Father Households Correlation Summary
| Measurement | Danish | European |
| Minimum | 0.21% | 0.42% |
| Maximum | 38.5% | 23.7% |
| Range | 38.2% | 23.3% |
| Mean | 3.9% | 4.1% |
| Median | 2.5% | 2.5% |
| Interquartile 25% (IQ1) | 2.1% | 2.1% |
| Interquartile 75% (IQ3) | 3.6% | 4.8% |
| Interquartile Range (IQR) | 1.5% | 2.7% |
| Standard Deviation (Sample) | 5.5% | 4.3% |
| Standard Deviation (Population) | 5.5% | 4.2% |
Similar Demographics by Single Father Households
Demographics Similar to Danes by Single Father Households
In terms of single father households, the demographic groups most similar to Danes are Colombian (2.3%, a difference of 0.010%), Immigrants from Jamaica (2.3%, a difference of 0.060%), Afghan (2.3%, a difference of 0.13%), Costa Rican (2.3%, a difference of 0.31%), and Welsh (2.3%, a difference of 0.31%).
| Demographics | Rating | Rank | Single Father Households |
| Czechs | 62.5 /100 | #169 | Good 2.3% |
| Ugandans | 62.2 /100 | #170 | Good 2.3% |
| Swedes | 61.6 /100 | #171 | Good 2.3% |
| Czechoslovakians | 58.9 /100 | #172 | Average 2.3% |
| Celtics | 55.4 /100 | #173 | Average 2.3% |
| Afghans | 50.0 /100 | #174 | Average 2.3% |
| Immigrants | Jamaica | 49.1 /100 | #175 | Average 2.3% |
| Danes | 48.2 /100 | #176 | Average 2.3% |
| Colombians | 48.0 /100 | #177 | Average 2.3% |
| Costa Ricans | 44.1 /100 | #178 | Average 2.3% |
| Welsh | 44.0 /100 | #179 | Average 2.3% |
| Yugoslavians | 43.9 /100 | #180 | Average 2.3% |
| Jamaicans | 43.5 /100 | #181 | Average 2.3% |
| Belgians | 43.3 /100 | #182 | Average 2.3% |
| Immigrants | Panama | 41.8 /100 | #183 | Average 2.4% |
Demographics Similar to Europeans by Single Father Households
In terms of single father households, the demographic groups most similar to Europeans are Bolivian (2.3%, a difference of 0.020%), Immigrants from South America (2.3%, a difference of 0.12%), Canadian (2.3%, a difference of 0.14%), Immigrants from Senegal (2.3%, a difference of 0.17%), and Immigrants from Germany (2.3%, a difference of 0.24%).
| Demographics | Rating | Rank | Single Father Households |
| South American Indians | 88.5 /100 | #148 | Excellent 2.3% |
| Senegalese | 88.4 /100 | #149 | Excellent 2.3% |
| Venezuelans | 86.2 /100 | #150 | Excellent 2.3% |
| Immigrants | Syria | 84.8 /100 | #151 | Excellent 2.3% |
| Immigrants | Venezuela | 83.2 /100 | #152 | Excellent 2.3% |
| Immigrants | Germany | 82.8 /100 | #153 | Excellent 2.3% |
| Bolivians | 81.0 /100 | #154 | Excellent 2.3% |
| Europeans | 80.9 /100 | #155 | Excellent 2.3% |
| Immigrants | South America | 79.9 /100 | #156 | Good 2.3% |
| Canadians | 79.7 /100 | #157 | Good 2.3% |
| Immigrants | Senegal | 79.4 /100 | #158 | Good 2.3% |
| Immigrants | West Indies | 77.9 /100 | #159 | Good 2.3% |
| Immigrants | Bolivia | 76.3 /100 | #160 | Good 2.3% |
| Swiss | 73.2 /100 | #161 | Good 2.3% |
| Scottish | 72.8 /100 | #162 | Good 2.3% |