Danish vs Malaysian Single Father Households
COMPARE
Danish
Malaysian
Single Father Households
Single Father Households Comparison
Danes
Malaysians
2.3%
SINGLE FATHER HOUSEHOLDS
48.2/ 100
METRIC RATING
176th/ 347
METRIC RANK
2.7%
SINGLE FATHER HOUSEHOLDS
0.0/ 100
METRIC RATING
294th/ 347
METRIC RANK
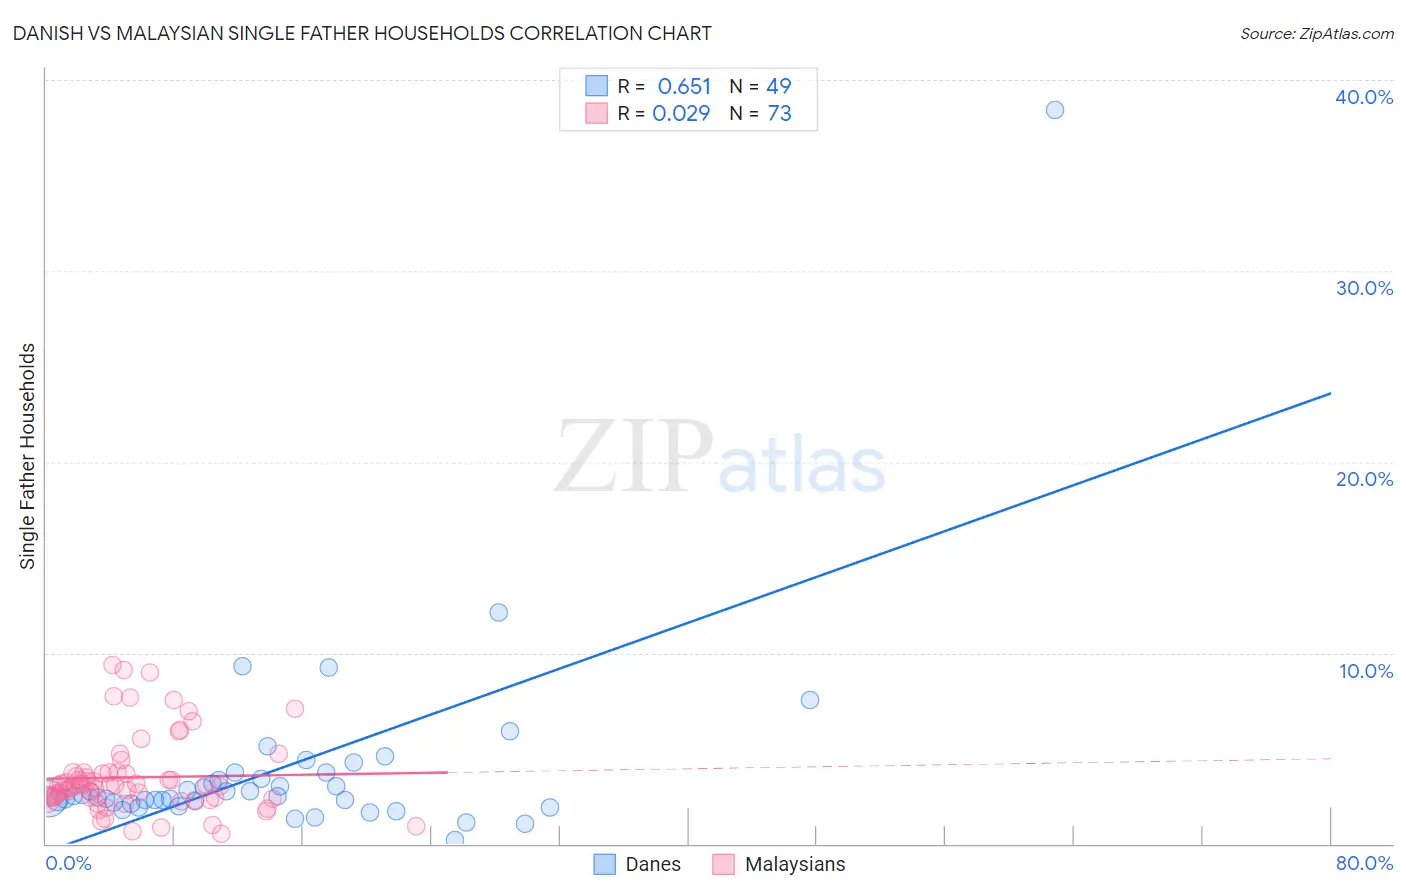
Danish vs Malaysian Single Father Households Correlation Chart
The statistical analysis conducted on geographies consisting of 466,880,679 people shows a significant positive correlation between the proportion of Danes and percentage of single father households in the United States with a correlation coefficient (R) of 0.651 and weighted average of 2.3%. Similarly, the statistical analysis conducted on geographies consisting of 225,437,553 people shows no correlation between the proportion of Malaysians and percentage of single father households in the United States with a correlation coefficient (R) of 0.029 and weighted average of 2.7%, a difference of 16.6%.
Single Father Households Correlation Summary
| Measurement | Danish | Malaysian |
| Minimum | 0.21% | 0.53% |
| Maximum | 38.5% | 9.3% |
| Range | 38.2% | 8.8% |
| Mean | 3.9% | 3.5% |
| Median | 2.5% | 3.1% |
| Interquartile 25% (IQ1) | 2.1% | 2.4% |
| Interquartile 75% (IQ3) | 3.6% | 3.7% |
| Interquartile Range (IQR) | 1.5% | 1.4% |
| Standard Deviation (Sample) | 5.5% | 2.0% |
| Standard Deviation (Population) | 5.5% | 2.0% |
Similar Demographics by Single Father Households
Demographics Similar to Danes by Single Father Households
In terms of single father households, the demographic groups most similar to Danes are Colombian (2.3%, a difference of 0.010%), Immigrants from Jamaica (2.3%, a difference of 0.060%), Afghan (2.3%, a difference of 0.13%), Costa Rican (2.3%, a difference of 0.31%), and Welsh (2.3%, a difference of 0.31%).
| Demographics | Rating | Rank | Single Father Households |
| Czechs | 62.5 /100 | #169 | Good 2.3% |
| Ugandans | 62.2 /100 | #170 | Good 2.3% |
| Swedes | 61.6 /100 | #171 | Good 2.3% |
| Czechoslovakians | 58.9 /100 | #172 | Average 2.3% |
| Celtics | 55.4 /100 | #173 | Average 2.3% |
| Afghans | 50.0 /100 | #174 | Average 2.3% |
| Immigrants | Jamaica | 49.1 /100 | #175 | Average 2.3% |
| Danes | 48.2 /100 | #176 | Average 2.3% |
| Colombians | 48.0 /100 | #177 | Average 2.3% |
| Costa Ricans | 44.1 /100 | #178 | Average 2.3% |
| Welsh | 44.0 /100 | #179 | Average 2.3% |
| Yugoslavians | 43.9 /100 | #180 | Average 2.3% |
| Jamaicans | 43.5 /100 | #181 | Average 2.3% |
| Belgians | 43.3 /100 | #182 | Average 2.3% |
| Immigrants | Panama | 41.8 /100 | #183 | Average 2.4% |
Demographics Similar to Malaysians by Single Father Households
In terms of single father households, the demographic groups most similar to Malaysians are Immigrants from Fiji (2.7%, a difference of 0.43%), Choctaw (2.7%, a difference of 0.59%), Chickasaw (2.8%, a difference of 0.80%), Japanese (2.8%, a difference of 0.83%), and Honduran (2.8%, a difference of 0.91%).
| Demographics | Rating | Rank | Single Father Households |
| Central American Indians | 0.0 /100 | #287 | Tragic 2.7% |
| Immigrants | Cambodia | 0.0 /100 | #288 | Tragic 2.7% |
| Tlingit-Haida | 0.0 /100 | #289 | Tragic 2.7% |
| Puget Sound Salish | 0.0 /100 | #290 | Tragic 2.7% |
| Blackfeet | 0.0 /100 | #291 | Tragic 2.7% |
| Choctaw | 0.0 /100 | #292 | Tragic 2.7% |
| Immigrants | Fiji | 0.0 /100 | #293 | Tragic 2.7% |
| Malaysians | 0.0 /100 | #294 | Tragic 2.7% |
| Chickasaw | 0.0 /100 | #295 | Tragic 2.8% |
| Japanese | 0.0 /100 | #296 | Tragic 2.8% |
| Hondurans | 0.0 /100 | #297 | Tragic 2.8% |
| Cree | 0.0 /100 | #298 | Tragic 2.8% |
| Lumbee | 0.0 /100 | #299 | Tragic 2.8% |
| Kiowa | 0.0 /100 | #300 | Tragic 2.8% |
| Immigrants | Latin America | 0.0 /100 | #301 | Tragic 2.8% |