Czechoslovakian vs Portuguese Single Mother Households
COMPARE
Czechoslovakian
Portuguese
Single Mother Households
Single Mother Households Comparison
Czechoslovakians
Portuguese
5.9%
SINGLE MOTHER HOUSEHOLDS
92.2/ 100
METRIC RATING
128th/ 347
METRIC RANK
6.4%
SINGLE MOTHER HOUSEHOLDS
40.0/ 100
METRIC RATING
178th/ 347
METRIC RANK
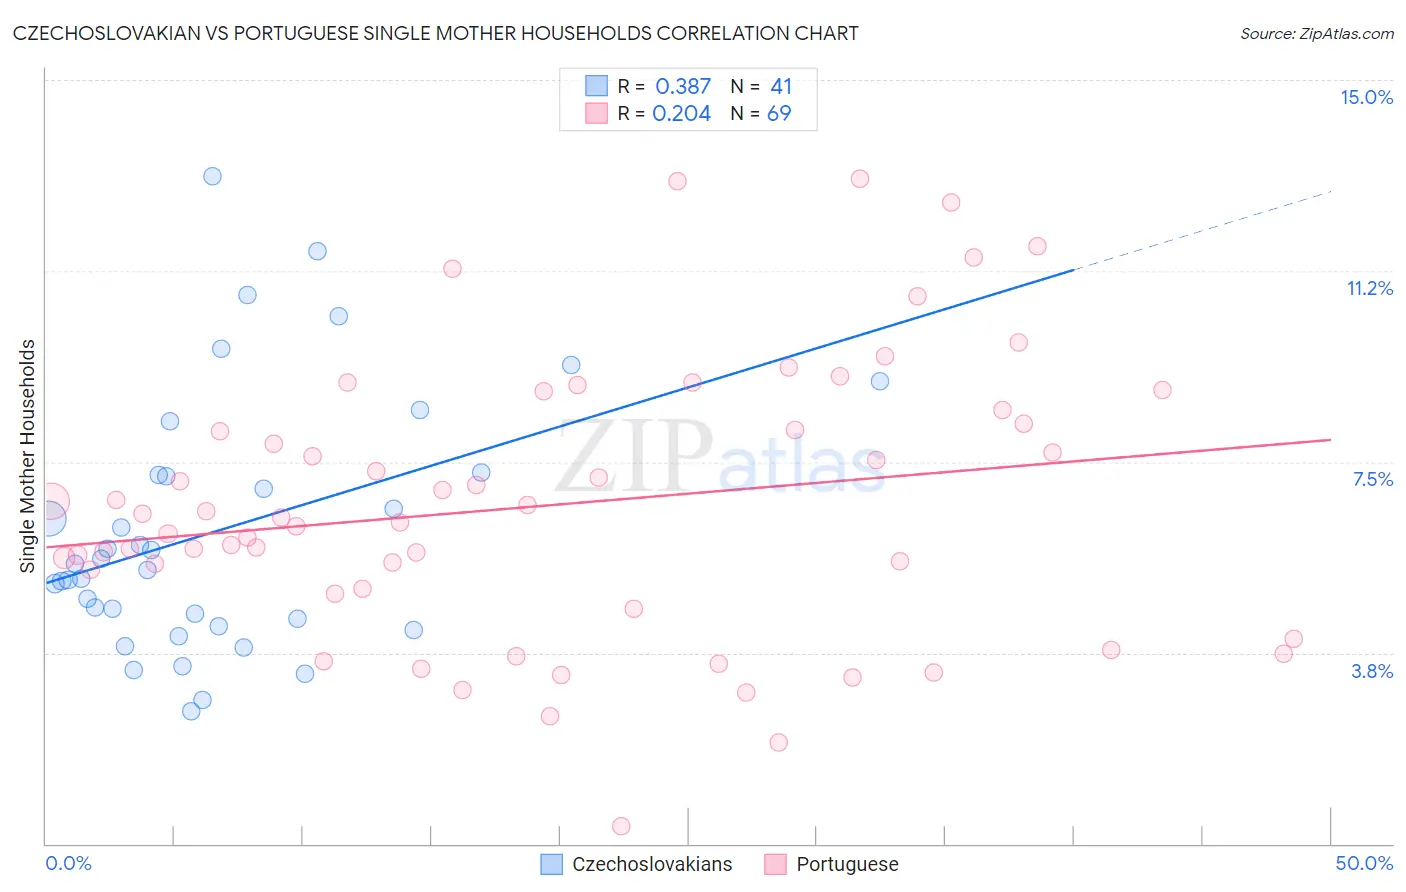
Czechoslovakian vs Portuguese Single Mother Households Correlation Chart
The statistical analysis conducted on geographies consisting of 367,454,114 people shows a mild positive correlation between the proportion of Czechoslovakians and percentage of single mother households in the United States with a correlation coefficient (R) of 0.387 and weighted average of 5.9%. Similarly, the statistical analysis conducted on geographies consisting of 448,231,637 people shows a weak positive correlation between the proportion of Portuguese and percentage of single mother households in the United States with a correlation coefficient (R) of 0.204 and weighted average of 6.4%, a difference of 8.4%.
Single Mother Households Correlation Summary
| Measurement | Czechoslovakian | Portuguese |
| Minimum | 2.6% | 0.35% |
| Maximum | 13.1% | 13.1% |
| Range | 10.5% | 12.7% |
| Mean | 6.2% | 6.7% |
| Median | 5.5% | 6.4% |
| Interquartile 25% (IQ1) | 4.3% | 5.0% |
| Interquartile 75% (IQ3) | 7.3% | 8.4% |
| Interquartile Range (IQR) | 2.9% | 3.4% |
| Standard Deviation (Sample) | 2.5% | 2.7% |
| Standard Deviation (Population) | 2.5% | 2.7% |
Similar Demographics by Single Mother Households
Demographics Similar to Czechoslovakians by Single Mother Households
In terms of single mother households, the demographic groups most similar to Czechoslovakians are Immigrants from Bolivia (5.9%, a difference of 0.010%), Palestinian (5.9%, a difference of 0.040%), Lebanese (5.9%, a difference of 0.080%), Welsh (5.9%, a difference of 0.27%), and Slavic (5.9%, a difference of 0.29%).
| Demographics | Rating | Rank | Single Mother Households |
| Argentineans | 93.7 /100 | #121 | Exceptional 5.8% |
| Belgians | 93.5 /100 | #122 | Exceptional 5.8% |
| Immigrants | Uzbekistan | 93.4 /100 | #123 | Exceptional 5.9% |
| Immigrants | Argentina | 93.2 /100 | #124 | Exceptional 5.9% |
| Slavs | 92.9 /100 | #125 | Exceptional 5.9% |
| Welsh | 92.8 /100 | #126 | Exceptional 5.9% |
| Lebanese | 92.4 /100 | #127 | Exceptional 5.9% |
| Czechoslovakians | 92.2 /100 | #128 | Exceptional 5.9% |
| Immigrants | Bolivia | 92.2 /100 | #129 | Exceptional 5.9% |
| Palestinians | 92.1 /100 | #130 | Exceptional 5.9% |
| Immigrants | Spain | 91.2 /100 | #131 | Exceptional 5.9% |
| Albanians | 91.1 /100 | #132 | Exceptional 5.9% |
| Egyptians | 90.7 /100 | #133 | Exceptional 5.9% |
| Canadians | 90.5 /100 | #134 | Exceptional 5.9% |
| Immigrants | Saudi Arabia | 90.2 /100 | #135 | Exceptional 5.9% |
Demographics Similar to Portuguese by Single Mother Households
In terms of single mother households, the demographic groups most similar to Portuguese are Hmong (6.4%, a difference of 0.020%), Osage (6.4%, a difference of 0.34%), Immigrants from Nepal (6.4%, a difference of 0.45%), Immigrants from Bosnia and Herzegovina (6.3%, a difference of 0.49%), and Marshallese (6.3%, a difference of 0.65%).
| Demographics | Rating | Rank | Single Mother Households |
| Afghans | 52.5 /100 | #171 | Average 6.3% |
| Immigrants | South Eastern Asia | 52.2 /100 | #172 | Average 6.3% |
| Immigrants | Vietnam | 51.5 /100 | #173 | Average 6.3% |
| Immigrants | Morocco | 50.0 /100 | #174 | Average 6.3% |
| Marshallese | 45.8 /100 | #175 | Average 6.3% |
| Immigrants | Bosnia and Herzegovina | 44.3 /100 | #176 | Average 6.3% |
| Osage | 43.0 /100 | #177 | Average 6.4% |
| Portuguese | 40.0 /100 | #178 | Fair 6.4% |
| Hmong | 39.8 /100 | #179 | Fair 6.4% |
| Immigrants | Nepal | 36.1 /100 | #180 | Fair 6.4% |
| Spanish | 33.4 /100 | #181 | Fair 6.4% |
| South American Indians | 33.4 /100 | #182 | Fair 6.4% |
| Spaniards | 27.8 /100 | #183 | Fair 6.5% |
| Ethiopians | 26.0 /100 | #184 | Fair 6.5% |
| Ugandans | 25.6 /100 | #185 | Fair 6.5% |