Czechoslovakian vs Uruguayan Single Mother Households
COMPARE
Czechoslovakian
Uruguayan
Single Mother Households
Single Mother Households Comparison
Czechoslovakians
Uruguayans
5.9%
SINGLE MOTHER HOUSEHOLDS
92.2/ 100
METRIC RATING
128th/ 347
METRIC RANK
6.6%
SINGLE MOTHER HOUSEHOLDS
18.0/ 100
METRIC RATING
196th/ 347
METRIC RANK
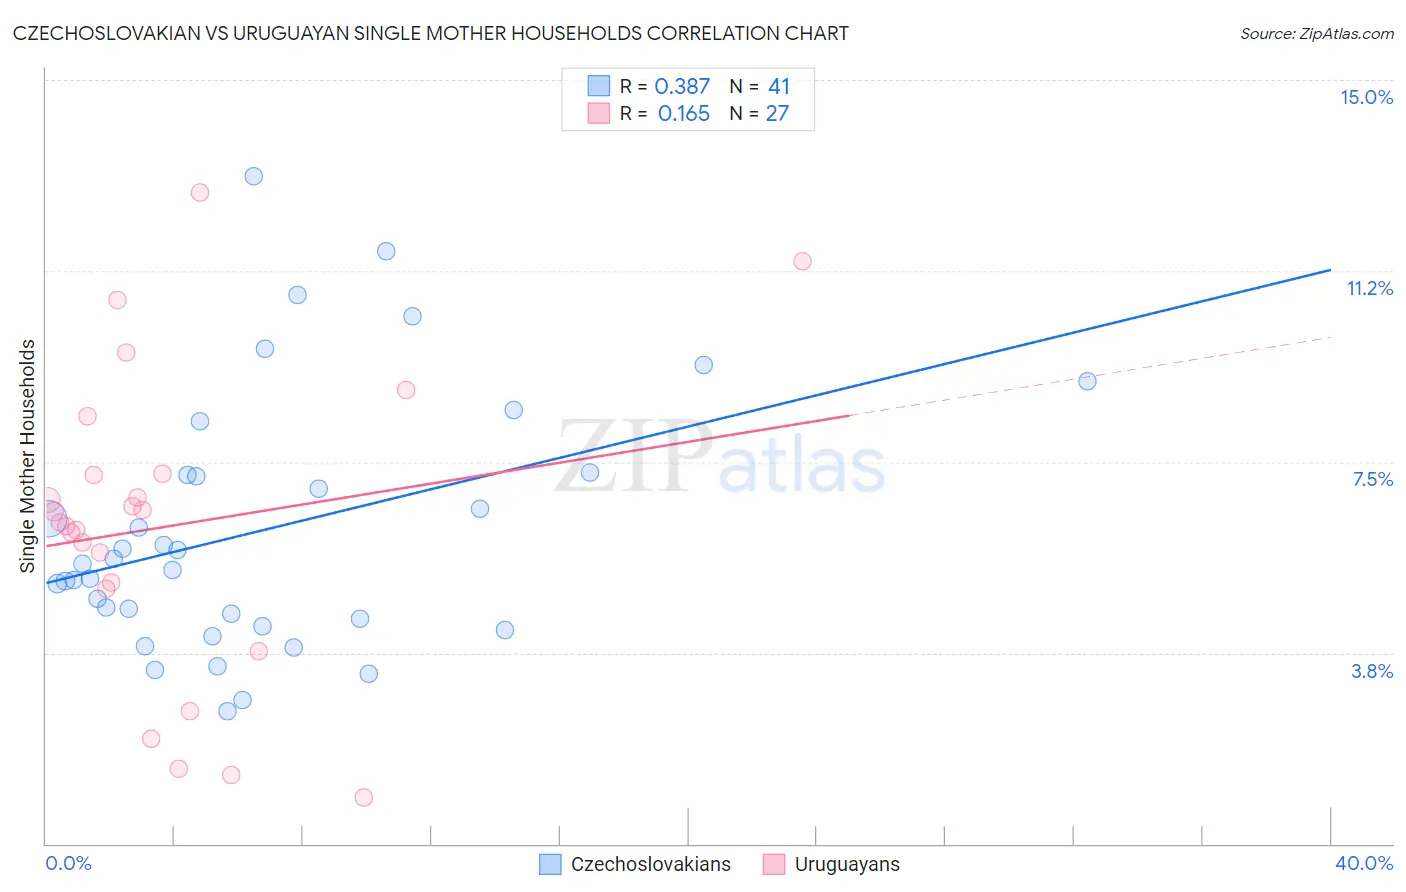
Czechoslovakian vs Uruguayan Single Mother Households Correlation Chart
The statistical analysis conducted on geographies consisting of 367,454,114 people shows a mild positive correlation between the proportion of Czechoslovakians and percentage of single mother households in the United States with a correlation coefficient (R) of 0.387 and weighted average of 5.9%. Similarly, the statistical analysis conducted on geographies consisting of 144,678,091 people shows a poor positive correlation between the proportion of Uruguayans and percentage of single mother households in the United States with a correlation coefficient (R) of 0.165 and weighted average of 6.6%, a difference of 11.7%.
Single Mother Households Correlation Summary
| Measurement | Czechoslovakian | Uruguayan |
| Minimum | 2.6% | 0.91% |
| Maximum | 13.1% | 12.8% |
| Range | 10.5% | 11.9% |
| Mean | 6.2% | 6.2% |
| Median | 5.5% | 6.3% |
| Interquartile 25% (IQ1) | 4.3% | 5.0% |
| Interquartile 75% (IQ3) | 7.3% | 7.3% |
| Interquartile Range (IQR) | 2.9% | 2.3% |
| Standard Deviation (Sample) | 2.5% | 3.0% |
| Standard Deviation (Population) | 2.5% | 2.9% |
Similar Demographics by Single Mother Households
Demographics Similar to Czechoslovakians by Single Mother Households
In terms of single mother households, the demographic groups most similar to Czechoslovakians are Immigrants from Bolivia (5.9%, a difference of 0.010%), Palestinian (5.9%, a difference of 0.040%), Lebanese (5.9%, a difference of 0.080%), Welsh (5.9%, a difference of 0.27%), and Slavic (5.9%, a difference of 0.29%).
| Demographics | Rating | Rank | Single Mother Households |
| Argentineans | 93.7 /100 | #121 | Exceptional 5.8% |
| Belgians | 93.5 /100 | #122 | Exceptional 5.8% |
| Immigrants | Uzbekistan | 93.4 /100 | #123 | Exceptional 5.9% |
| Immigrants | Argentina | 93.2 /100 | #124 | Exceptional 5.9% |
| Slavs | 92.9 /100 | #125 | Exceptional 5.9% |
| Welsh | 92.8 /100 | #126 | Exceptional 5.9% |
| Lebanese | 92.4 /100 | #127 | Exceptional 5.9% |
| Czechoslovakians | 92.2 /100 | #128 | Exceptional 5.9% |
| Immigrants | Bolivia | 92.2 /100 | #129 | Exceptional 5.9% |
| Palestinians | 92.1 /100 | #130 | Exceptional 5.9% |
| Immigrants | Spain | 91.2 /100 | #131 | Exceptional 5.9% |
| Albanians | 91.1 /100 | #132 | Exceptional 5.9% |
| Egyptians | 90.7 /100 | #133 | Exceptional 5.9% |
| Canadians | 90.5 /100 | #134 | Exceptional 5.9% |
| Immigrants | Saudi Arabia | 90.2 /100 | #135 | Exceptional 5.9% |
Demographics Similar to Uruguayans by Single Mother Households
In terms of single mother households, the demographic groups most similar to Uruguayans are South American (6.6%, a difference of 0.0%), Colombian (6.6%, a difference of 0.050%), Immigrants from Uganda (6.6%, a difference of 0.050%), Moroccan (6.6%, a difference of 0.11%), and American (6.6%, a difference of 0.17%).
| Demographics | Rating | Rank | Single Mother Households |
| Delaware | 23.3 /100 | #189 | Fair 6.5% |
| Peruvians | 21.6 /100 | #190 | Fair 6.5% |
| Samoans | 21.2 /100 | #191 | Fair 6.5% |
| Americans | 19.0 /100 | #192 | Poor 6.6% |
| Colombians | 18.3 /100 | #193 | Poor 6.6% |
| Immigrants | Uganda | 18.3 /100 | #194 | Poor 6.6% |
| South Americans | 18.0 /100 | #195 | Poor 6.6% |
| Uruguayans | 18.0 /100 | #196 | Poor 6.6% |
| Moroccans | 17.4 /100 | #197 | Poor 6.6% |
| Hawaiians | 16.1 /100 | #198 | Poor 6.6% |
| Potawatomi | 15.5 /100 | #199 | Poor 6.6% |
| Immigrants | Ethiopia | 14.7 /100 | #200 | Poor 6.6% |
| Venezuelans | 12.9 /100 | #201 | Poor 6.6% |
| Guamanians/Chamorros | 12.4 /100 | #202 | Poor 6.6% |
| Immigrants | Peru | 12.0 /100 | #203 | Poor 6.7% |