Czechoslovakian vs Chippewa Single Mother Households
COMPARE
Czechoslovakian
Chippewa
Single Mother Households
Single Mother Households Comparison
Czechoslovakians
Chippewa
5.9%
SINGLE MOTHER HOUSEHOLDS
92.2/ 100
METRIC RATING
128th/ 347
METRIC RANK
8.0%
SINGLE MOTHER HOUSEHOLDS
0.0/ 100
METRIC RATING
301st/ 347
METRIC RANK
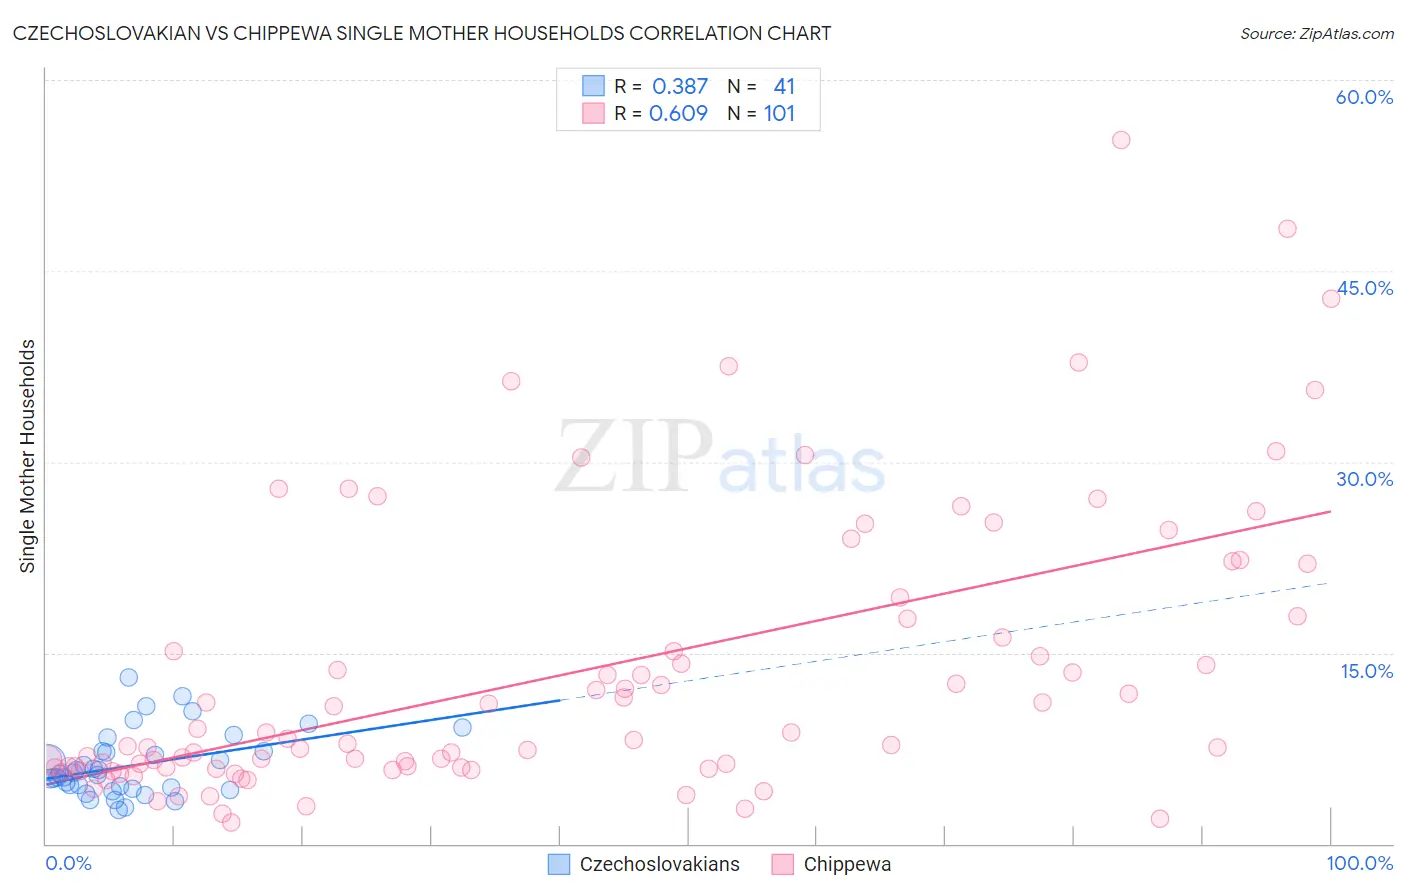
Czechoslovakian vs Chippewa Single Mother Households Correlation Chart
The statistical analysis conducted on geographies consisting of 367,454,114 people shows a mild positive correlation between the proportion of Czechoslovakians and percentage of single mother households in the United States with a correlation coefficient (R) of 0.387 and weighted average of 5.9%. Similarly, the statistical analysis conducted on geographies consisting of 214,662,896 people shows a significant positive correlation between the proportion of Chippewa and percentage of single mother households in the United States with a correlation coefficient (R) of 0.609 and weighted average of 8.0%, a difference of 35.6%.
Single Mother Households Correlation Summary
| Measurement | Czechoslovakian | Chippewa |
| Minimum | 2.6% | 1.7% |
| Maximum | 13.1% | 55.3% |
| Range | 10.5% | 53.6% |
| Mean | 6.2% | 13.4% |
| Median | 5.5% | 8.2% |
| Interquartile 25% (IQ1) | 4.3% | 6.0% |
| Interquartile 75% (IQ3) | 7.3% | 17.8% |
| Interquartile Range (IQR) | 2.9% | 11.8% |
| Standard Deviation (Sample) | 2.5% | 11.0% |
| Standard Deviation (Population) | 2.5% | 11.0% |
Similar Demographics by Single Mother Households
Demographics Similar to Czechoslovakians by Single Mother Households
In terms of single mother households, the demographic groups most similar to Czechoslovakians are Immigrants from Bolivia (5.9%, a difference of 0.010%), Palestinian (5.9%, a difference of 0.040%), Lebanese (5.9%, a difference of 0.080%), Welsh (5.9%, a difference of 0.27%), and Slavic (5.9%, a difference of 0.29%).
| Demographics | Rating | Rank | Single Mother Households |
| Argentineans | 93.7 /100 | #121 | Exceptional 5.8% |
| Belgians | 93.5 /100 | #122 | Exceptional 5.8% |
| Immigrants | Uzbekistan | 93.4 /100 | #123 | Exceptional 5.9% |
| Immigrants | Argentina | 93.2 /100 | #124 | Exceptional 5.9% |
| Slavs | 92.9 /100 | #125 | Exceptional 5.9% |
| Welsh | 92.8 /100 | #126 | Exceptional 5.9% |
| Lebanese | 92.4 /100 | #127 | Exceptional 5.9% |
| Czechoslovakians | 92.2 /100 | #128 | Exceptional 5.9% |
| Immigrants | Bolivia | 92.2 /100 | #129 | Exceptional 5.9% |
| Palestinians | 92.1 /100 | #130 | Exceptional 5.9% |
| Immigrants | Spain | 91.2 /100 | #131 | Exceptional 5.9% |
| Albanians | 91.1 /100 | #132 | Exceptional 5.9% |
| Egyptians | 90.7 /100 | #133 | Exceptional 5.9% |
| Canadians | 90.5 /100 | #134 | Exceptional 5.9% |
| Immigrants | Saudi Arabia | 90.2 /100 | #135 | Exceptional 5.9% |
Demographics Similar to Chippewa by Single Mother Households
In terms of single mother households, the demographic groups most similar to Chippewa are Immigrants from Ghana (8.0%, a difference of 0.10%), Immigrants from Bahamas (8.0%, a difference of 0.12%), Mexican (8.0%, a difference of 0.16%), Native/Alaskan (8.0%, a difference of 0.56%), and Colville (8.0%, a difference of 0.61%).
| Demographics | Rating | Rank | Single Mother Households |
| Apache | 0.0 /100 | #294 | Tragic 7.9% |
| Barbadians | 0.0 /100 | #295 | Tragic 7.9% |
| Immigrants | Latin America | 0.0 /100 | #296 | Tragic 7.9% |
| Hispanics or Latinos | 0.0 /100 | #297 | Tragic 7.9% |
| Immigrants | West Indies | 0.0 /100 | #298 | Tragic 7.9% |
| Houma | 0.0 /100 | #299 | Tragic 7.9% |
| Mexicans | 0.0 /100 | #300 | Tragic 8.0% |
| Chippewa | 0.0 /100 | #301 | Tragic 8.0% |
| Immigrants | Ghana | 0.0 /100 | #302 | Tragic 8.0% |
| Immigrants | Bahamas | 0.0 /100 | #303 | Tragic 8.0% |
| Natives/Alaskans | 0.0 /100 | #304 | Tragic 8.0% |
| Colville | 0.0 /100 | #305 | Tragic 8.0% |
| Immigrants | Barbados | 0.0 /100 | #306 | Tragic 8.0% |
| Immigrants | St. Vincent and the Grenadines | 0.0 /100 | #307 | Tragic 8.0% |
| Immigrants | Central America | 0.0 /100 | #308 | Tragic 8.1% |