Immigrants from Panama vs Mexican Single Mother Households
COMPARE
Immigrants from Panama
Mexican
Single Mother Households
Single Mother Households Comparison
Immigrants from Panama
Mexicans
7.2%
SINGLE MOTHER HOUSEHOLDS
0.7/ 100
METRIC RATING
240th/ 347
METRIC RANK
8.0%
SINGLE MOTHER HOUSEHOLDS
0.0/ 100
METRIC RATING
300th/ 347
METRIC RANK
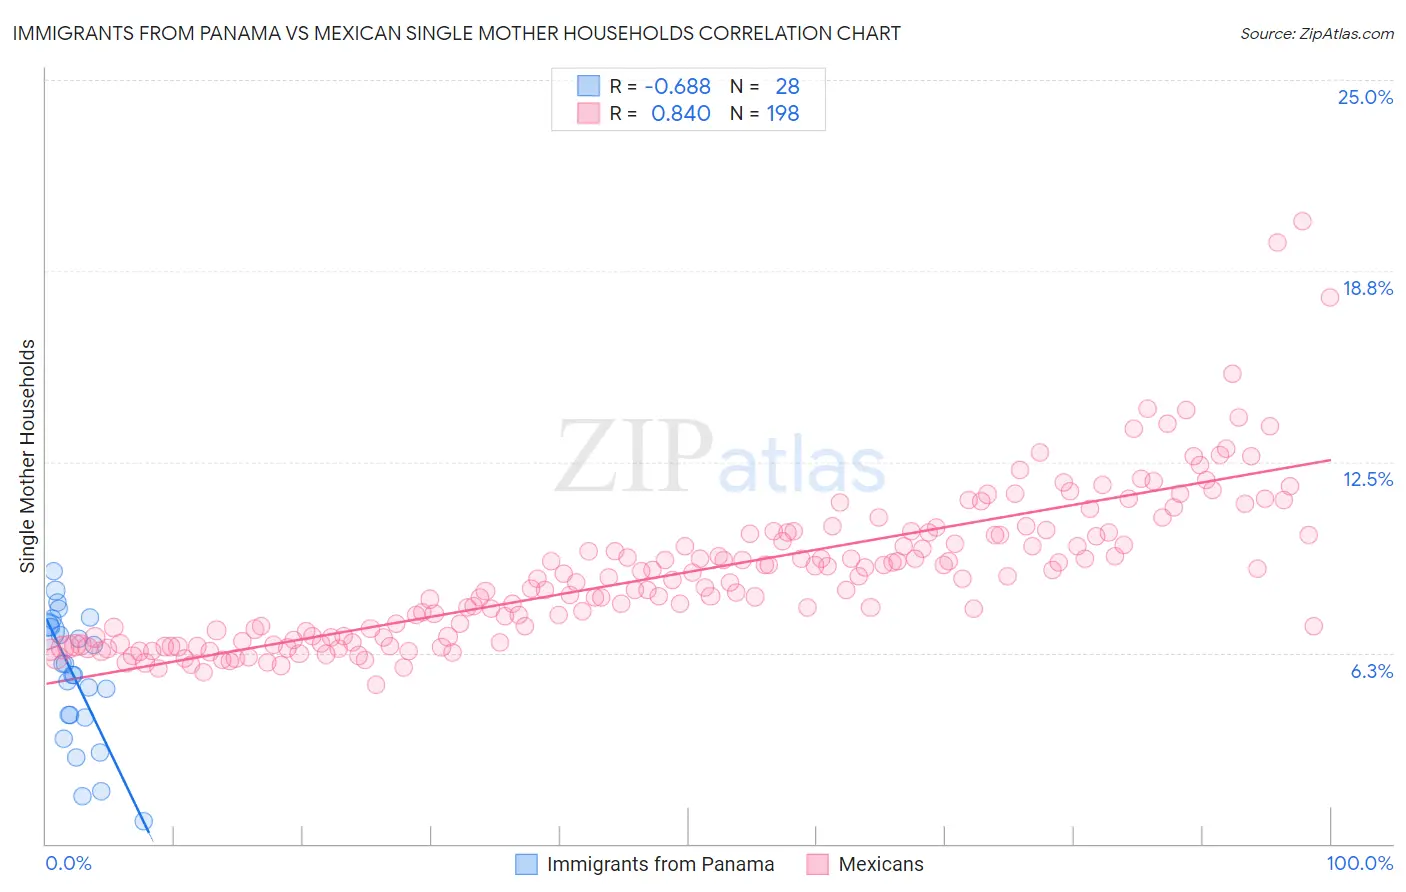
Immigrants from Panama vs Mexican Single Mother Households Correlation Chart
The statistical analysis conducted on geographies consisting of 221,053,842 people shows a significant negative correlation between the proportion of Immigrants from Panama and percentage of single mother households in the United States with a correlation coefficient (R) of -0.688 and weighted average of 7.2%. Similarly, the statistical analysis conducted on geographies consisting of 560,737,784 people shows a very strong positive correlation between the proportion of Mexicans and percentage of single mother households in the United States with a correlation coefficient (R) of 0.840 and weighted average of 8.0%, a difference of 11.2%.
Single Mother Households Correlation Summary
| Measurement | Immigrants from Panama | Mexican |
| Minimum | 0.75% | 5.2% |
| Maximum | 8.9% | 20.4% |
| Range | 8.2% | 15.2% |
| Mean | 5.5% | 8.9% |
| Median | 5.7% | 8.7% |
| Interquartile 25% (IQ1) | 4.2% | 6.8% |
| Interquartile 75% (IQ3) | 7.1% | 10.1% |
| Interquartile Range (IQR) | 3.0% | 3.4% |
| Standard Deviation (Sample) | 2.1% | 2.5% |
| Standard Deviation (Population) | 2.1% | 2.5% |
Similar Demographics by Single Mother Households
Demographics Similar to Immigrants from Panama by Single Mother Households
In terms of single mother households, the demographic groups most similar to Immigrants from Panama are Kiowa (7.1%, a difference of 0.32%), Immigrants from Portugal (7.2%, a difference of 0.35%), Fijian (7.2%, a difference of 0.43%), Ecuadorian (7.2%, a difference of 0.48%), and Cuban (7.2%, a difference of 0.54%).
| Demographics | Rating | Rank | Single Mother Households |
| Choctaw | 1.4 /100 | #233 | Tragic 7.0% |
| Chickasaw | 1.4 /100 | #234 | Tragic 7.0% |
| Immigrants | Burma/Myanmar | 1.4 /100 | #235 | Tragic 7.0% |
| Ute | 1.0 /100 | #236 | Tragic 7.1% |
| Arapaho | 1.0 /100 | #237 | Tragic 7.1% |
| Panamanians | 0.9 /100 | #238 | Tragic 7.1% |
| Kiowa | 0.8 /100 | #239 | Tragic 7.1% |
| Immigrants | Panama | 0.7 /100 | #240 | Tragic 7.2% |
| Immigrants | Portugal | 0.6 /100 | #241 | Tragic 7.2% |
| Fijians | 0.6 /100 | #242 | Tragic 7.2% |
| Ecuadorians | 0.6 /100 | #243 | Tragic 7.2% |
| Cubans | 0.6 /100 | #244 | Tragic 7.2% |
| Immigrants | Cambodia | 0.5 /100 | #245 | Tragic 7.2% |
| Nicaraguans | 0.5 /100 | #246 | Tragic 7.2% |
| Dutch West Indians | 0.4 /100 | #247 | Tragic 7.3% |
Demographics Similar to Mexicans by Single Mother Households
In terms of single mother households, the demographic groups most similar to Mexicans are Chippewa (8.0%, a difference of 0.16%), Immigrants from Ghana (8.0%, a difference of 0.25%), Immigrants from Bahamas (8.0%, a difference of 0.27%), Houma (7.9%, a difference of 0.46%), and Immigrants from West Indies (7.9%, a difference of 0.54%).
| Demographics | Rating | Rank | Single Mother Households |
| Immigrants | Cameroon | 0.0 /100 | #293 | Tragic 7.9% |
| Apache | 0.0 /100 | #294 | Tragic 7.9% |
| Barbadians | 0.0 /100 | #295 | Tragic 7.9% |
| Immigrants | Latin America | 0.0 /100 | #296 | Tragic 7.9% |
| Hispanics or Latinos | 0.0 /100 | #297 | Tragic 7.9% |
| Immigrants | West Indies | 0.0 /100 | #298 | Tragic 7.9% |
| Houma | 0.0 /100 | #299 | Tragic 7.9% |
| Mexicans | 0.0 /100 | #300 | Tragic 8.0% |
| Chippewa | 0.0 /100 | #301 | Tragic 8.0% |
| Immigrants | Ghana | 0.0 /100 | #302 | Tragic 8.0% |
| Immigrants | Bahamas | 0.0 /100 | #303 | Tragic 8.0% |
| Natives/Alaskans | 0.0 /100 | #304 | Tragic 8.0% |
| Colville | 0.0 /100 | #305 | Tragic 8.0% |
| Immigrants | Barbados | 0.0 /100 | #306 | Tragic 8.0% |
| Immigrants | St. Vincent and the Grenadines | 0.0 /100 | #307 | Tragic 8.0% |