Cypriot vs Immigrants from Lebanon Family Households with Children
COMPARE
Cypriot
Immigrants from Lebanon
Family Households with Children
Family Households with Children Comparison
Cypriots
Immigrants from Lebanon
25.9%
FAMILY HOUSEHOLDS WITH CHILDREN
0.0/ 100
METRIC RATING
329th/ 347
METRIC RANK
28.6%
FAMILY HOUSEHOLDS WITH CHILDREN
99.9/ 100
METRIC RATING
63rd/ 347
METRIC RANK
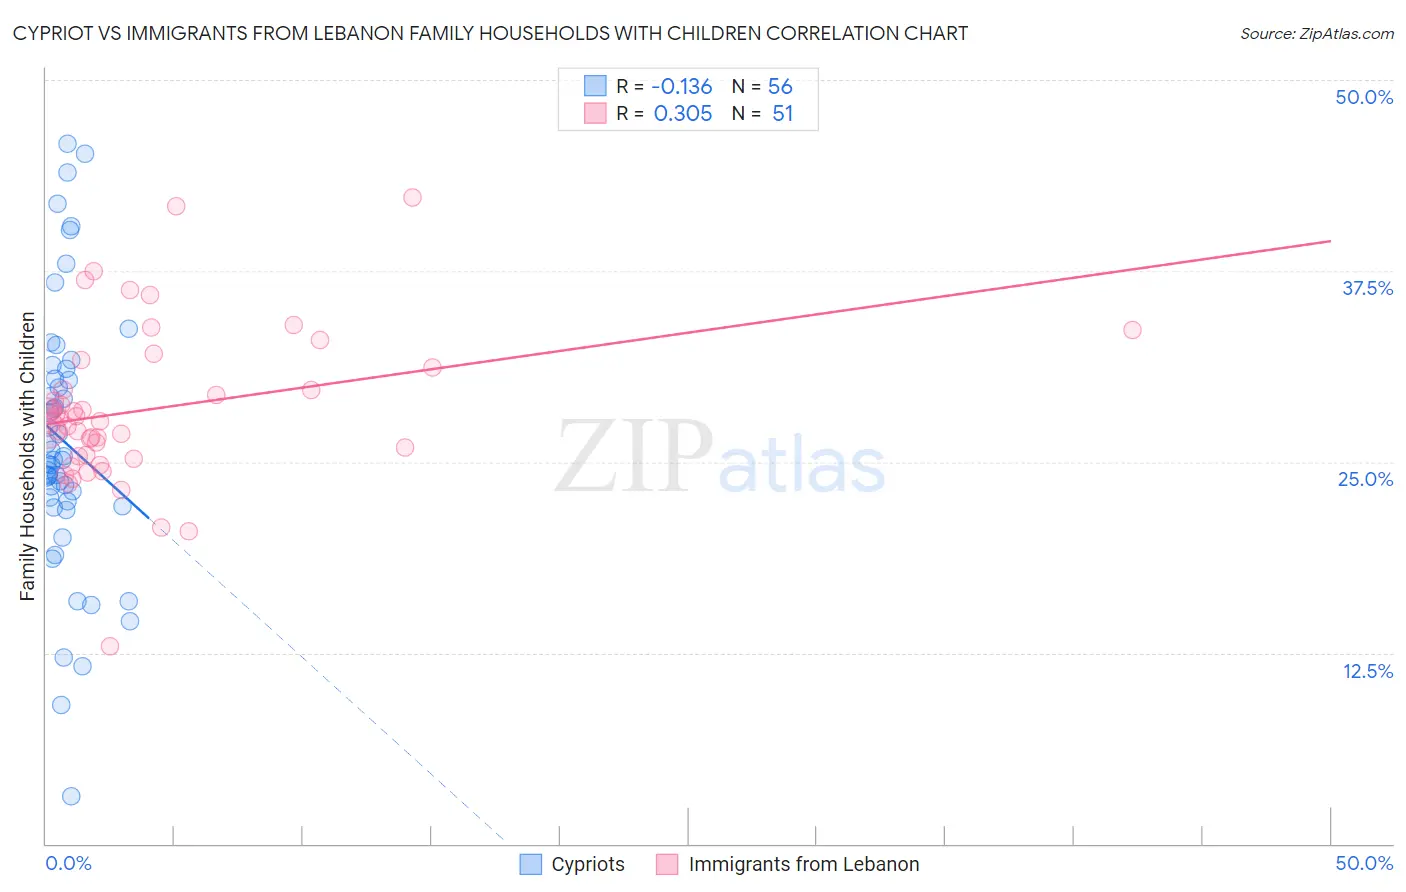
Cypriot vs Immigrants from Lebanon Family Households with Children Correlation Chart
The statistical analysis conducted on geographies consisting of 61,838,668 people shows a poor negative correlation between the proportion of Cypriots and percentage of family households with children in the United States with a correlation coefficient (R) of -0.136 and weighted average of 25.9%. Similarly, the statistical analysis conducted on geographies consisting of 217,098,842 people shows a mild positive correlation between the proportion of Immigrants from Lebanon and percentage of family households with children in the United States with a correlation coefficient (R) of 0.305 and weighted average of 28.6%, a difference of 10.3%.
Family Households with Children Correlation Summary
| Measurement | Cypriot | Immigrants from Lebanon |
| Minimum | 3.1% | 12.9% |
| Maximum | 45.8% | 42.3% |
| Range | 42.7% | 29.3% |
| Mean | 26.3% | 28.4% |
| Median | 25.1% | 27.7% |
| Interquartile 25% (IQ1) | 22.3% | 25.4% |
| Interquartile 75% (IQ3) | 30.8% | 31.2% |
| Interquartile Range (IQR) | 8.5% | 5.8% |
| Standard Deviation (Sample) | 8.8% | 5.2% |
| Standard Deviation (Population) | 8.7% | 5.2% |
Similar Demographics by Family Households with Children
Demographics Similar to Cypriots by Family Households with Children
In terms of family households with children, the demographic groups most similar to Cypriots are Immigrants from Albania (25.9%, a difference of 0.13%), Immigrants from Latvia (25.9%, a difference of 0.18%), Immigrants from Barbados (26.0%, a difference of 0.23%), Slovene (25.8%, a difference of 0.31%), and Immigrants from Ireland (26.0%, a difference of 0.33%).
| Demographics | Rating | Rank | Family Households with Children |
| Immigrants | Greece | 0.0 /100 | #322 | Tragic 26.0% |
| Immigrants | Australia | 0.0 /100 | #323 | Tragic 26.0% |
| Chinese | 0.0 /100 | #324 | Tragic 26.0% |
| Barbadians | 0.0 /100 | #325 | Tragic 26.0% |
| Immigrants | Ireland | 0.0 /100 | #326 | Tragic 26.0% |
| Immigrants | Barbados | 0.0 /100 | #327 | Tragic 26.0% |
| Immigrants | Albania | 0.0 /100 | #328 | Tragic 25.9% |
| Cypriots | 0.0 /100 | #329 | Tragic 25.9% |
| Immigrants | Latvia | 0.0 /100 | #330 | Tragic 25.9% |
| Slovenes | 0.0 /100 | #331 | Tragic 25.8% |
| Immigrants | Austria | 0.0 /100 | #332 | Tragic 25.8% |
| Immigrants | Switzerland | 0.0 /100 | #333 | Tragic 25.7% |
| Slovaks | 0.0 /100 | #334 | Tragic 25.7% |
| Immigrants | Croatia | 0.0 /100 | #335 | Tragic 25.7% |
| Immigrants | West Indies | 0.0 /100 | #336 | Tragic 25.7% |
Demographics Similar to Immigrants from Lebanon by Family Households with Children
In terms of family households with children, the demographic groups most similar to Immigrants from Lebanon are Immigrants from Ghana (28.6%, a difference of 0.010%), Egyptian (28.6%, a difference of 0.010%), Filipino (28.6%, a difference of 0.070%), Hmong (28.6%, a difference of 0.090%), and Immigrants from Nigeria (28.6%, a difference of 0.14%).
| Demographics | Rating | Rank | Family Households with Children |
| Immigrants | Guatemala | 100.0 /100 | #56 | Exceptional 28.8% |
| Danes | 100.0 /100 | #57 | Exceptional 28.7% |
| Hawaiians | 100.0 /100 | #58 | Exceptional 28.7% |
| Immigrants | Nigeria | 100.0 /100 | #59 | Exceptional 28.6% |
| Hmong | 99.9 /100 | #60 | Exceptional 28.6% |
| Immigrants | Ghana | 99.9 /100 | #61 | Exceptional 28.6% |
| Egyptians | 99.9 /100 | #62 | Exceptional 28.6% |
| Immigrants | Lebanon | 99.9 /100 | #63 | Exceptional 28.6% |
| Filipinos | 99.9 /100 | #64 | Exceptional 28.6% |
| Hondurans | 99.9 /100 | #65 | Exceptional 28.5% |
| Immigrants | Egypt | 99.9 /100 | #66 | Exceptional 28.5% |
| Ghanaians | 99.9 /100 | #67 | Exceptional 28.5% |
| Houma | 99.9 /100 | #68 | Exceptional 28.5% |
| Immigrants | Korea | 99.9 /100 | #69 | Exceptional 28.5% |
| Immigrants | Honduras | 99.9 /100 | #70 | Exceptional 28.5% |