Cypriot vs Carpatho Rusyn Currently Married
COMPARE
Cypriot
Carpatho Rusyn
Currently Married
Currently Married Comparison
Cypriots
Carpatho Rusyns
47.8%
CURRENTLY MARRIED
93.7/ 100
METRIC RATING
103rd/ 347
METRIC RANK
47.0%
CURRENTLY MARRIED
72.6/ 100
METRIC RATING
146th/ 347
METRIC RANK
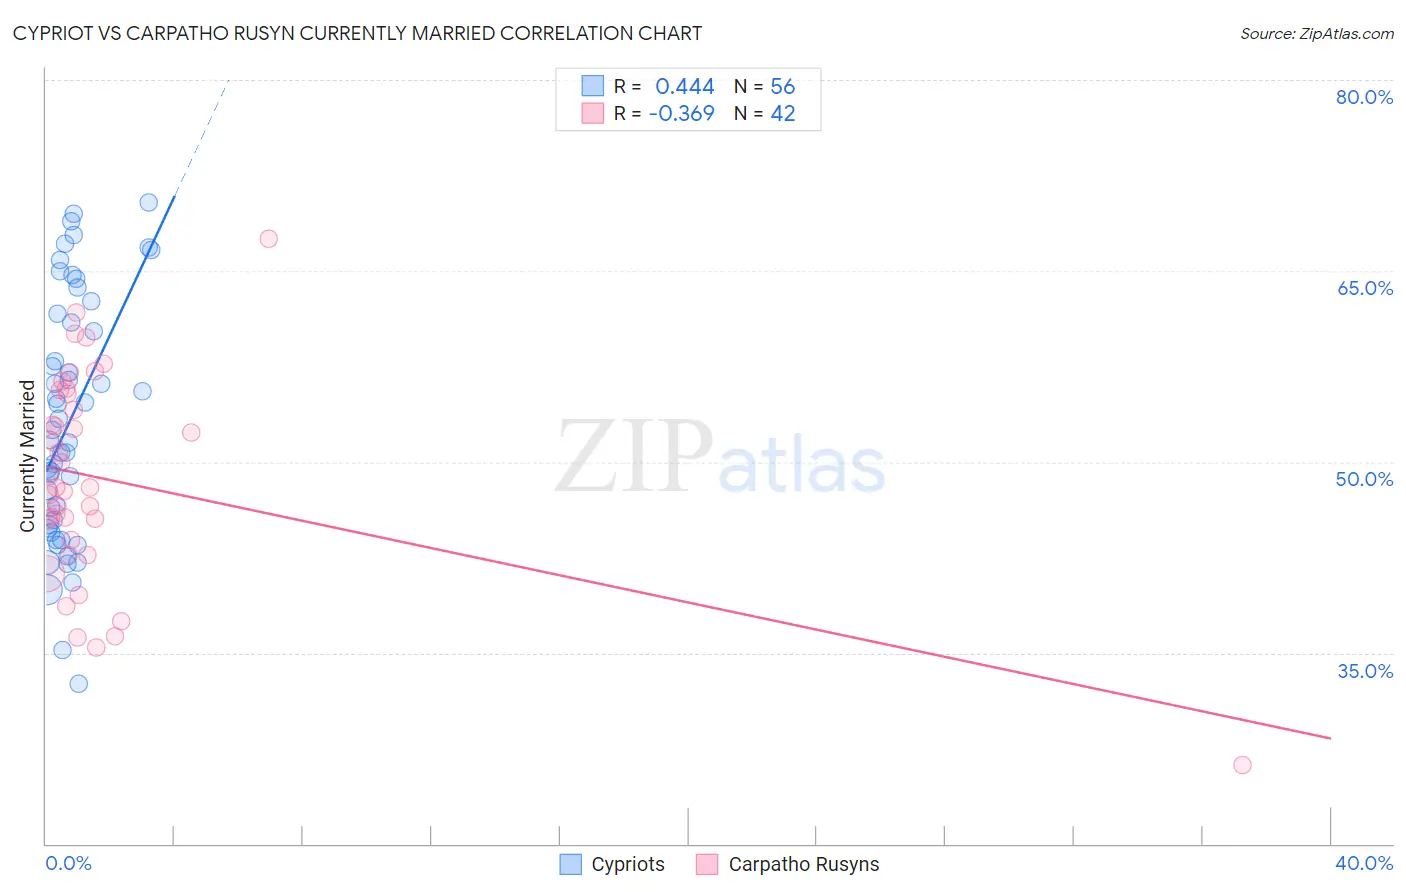
Cypriot vs Carpatho Rusyn Currently Married Correlation Chart
The statistical analysis conducted on geographies consisting of 61,862,826 people shows a moderate positive correlation between the proportion of Cypriots and percentage of population currently married in the United States with a correlation coefficient (R) of 0.444 and weighted average of 47.8%. Similarly, the statistical analysis conducted on geographies consisting of 58,871,690 people shows a mild negative correlation between the proportion of Carpatho Rusyns and percentage of population currently married in the United States with a correlation coefficient (R) of -0.369 and weighted average of 47.0%, a difference of 1.6%.
Currently Married Correlation Summary
| Measurement | Cypriot | Carpatho Rusyn |
| Minimum | 32.6% | 26.2% |
| Maximum | 70.4% | 67.5% |
| Range | 37.8% | 41.3% |
| Mean | 53.2% | 48.6% |
| Median | 52.1% | 48.0% |
| Interquartile 25% (IQ1) | 44.9% | 43.8% |
| Interquartile 75% (IQ3) | 61.3% | 55.3% |
| Interquartile Range (IQR) | 16.4% | 11.5% |
| Standard Deviation (Sample) | 9.6% | 8.3% |
| Standard Deviation (Population) | 9.5% | 8.2% |
Similar Demographics by Currently Married
Demographics Similar to Cypriots by Currently Married
In terms of currently married, the demographic groups most similar to Cypriots are Serbian (47.8%, a difference of 0.020%), Turkish (47.8%, a difference of 0.030%), Immigrants from Germany (47.8%, a difference of 0.050%), Celtic (47.8%, a difference of 0.070%), and Immigrants from Singapore (47.8%, a difference of 0.070%).
| Demographics | Rating | Rank | Currently Married |
| Egyptians | 94.8 /100 | #96 | Exceptional 47.9% |
| Immigrants | Ukraine | 94.8 /100 | #97 | Exceptional 47.9% |
| Immigrants | China | 94.7 /100 | #98 | Exceptional 47.9% |
| Immigrants | Sweden | 94.3 /100 | #99 | Exceptional 47.8% |
| Celtics | 94.2 /100 | #100 | Exceptional 47.8% |
| Immigrants | Germany | 94.1 /100 | #101 | Exceptional 47.8% |
| Turks | 93.9 /100 | #102 | Exceptional 47.8% |
| Cypriots | 93.7 /100 | #103 | Exceptional 47.8% |
| Serbians | 93.6 /100 | #104 | Exceptional 47.8% |
| Immigrants | Singapore | 93.3 /100 | #105 | Exceptional 47.8% |
| Immigrants | Greece | 93.1 /100 | #106 | Exceptional 47.7% |
| Immigrants | Italy | 92.9 /100 | #107 | Exceptional 47.7% |
| Tsimshian | 92.4 /100 | #108 | Exceptional 47.7% |
| Immigrants | Egypt | 92.3 /100 | #109 | Exceptional 47.7% |
| Immigrants | Russia | 92.0 /100 | #110 | Exceptional 47.7% |
Demographics Similar to Carpatho Rusyns by Currently Married
In terms of currently married, the demographic groups most similar to Carpatho Rusyns are Immigrants from South Eastern Asia (47.1%, a difference of 0.010%), Immigrants from Argentina (47.0%, a difference of 0.030%), Hmong (47.1%, a difference of 0.040%), Guamanian/Chamorro (47.1%, a difference of 0.070%), and Venezuelan (47.1%, a difference of 0.080%).
| Demographics | Rating | Rank | Currently Married |
| Yugoslavians | 77.4 /100 | #139 | Good 47.2% |
| Cajuns | 75.3 /100 | #140 | Good 47.1% |
| Venezuelans | 74.4 /100 | #141 | Good 47.1% |
| Argentineans | 74.4 /100 | #142 | Good 47.1% |
| Guamanians/Chamorros | 74.2 /100 | #143 | Good 47.1% |
| Hmong | 73.4 /100 | #144 | Good 47.1% |
| Immigrants | South Eastern Asia | 72.9 /100 | #145 | Good 47.1% |
| Carpatho Rusyns | 72.6 /100 | #146 | Good 47.0% |
| Immigrants | Argentina | 72.0 /100 | #147 | Good 47.0% |
| Cambodians | 70.4 /100 | #148 | Good 47.0% |
| Zimbabweans | 70.1 /100 | #149 | Good 47.0% |
| Immigrants | Turkey | 70.0 /100 | #150 | Good 47.0% |
| Chileans | 69.8 /100 | #151 | Good 47.0% |
| Immigrants | Serbia | 68.8 /100 | #152 | Good 47.0% |
| Immigrants | Venezuela | 68.6 /100 | #153 | Good 47.0% |