Cypriot vs Dutch Currently Married
COMPARE
Cypriot
Dutch
Currently Married
Currently Married Comparison
Cypriots
Dutch
47.8%
CURRENTLY MARRIED
93.7/ 100
METRIC RATING
103rd/ 347
METRIC RANK
49.6%
CURRENTLY MARRIED
99.9/ 100
METRIC RATING
13th/ 347
METRIC RANK
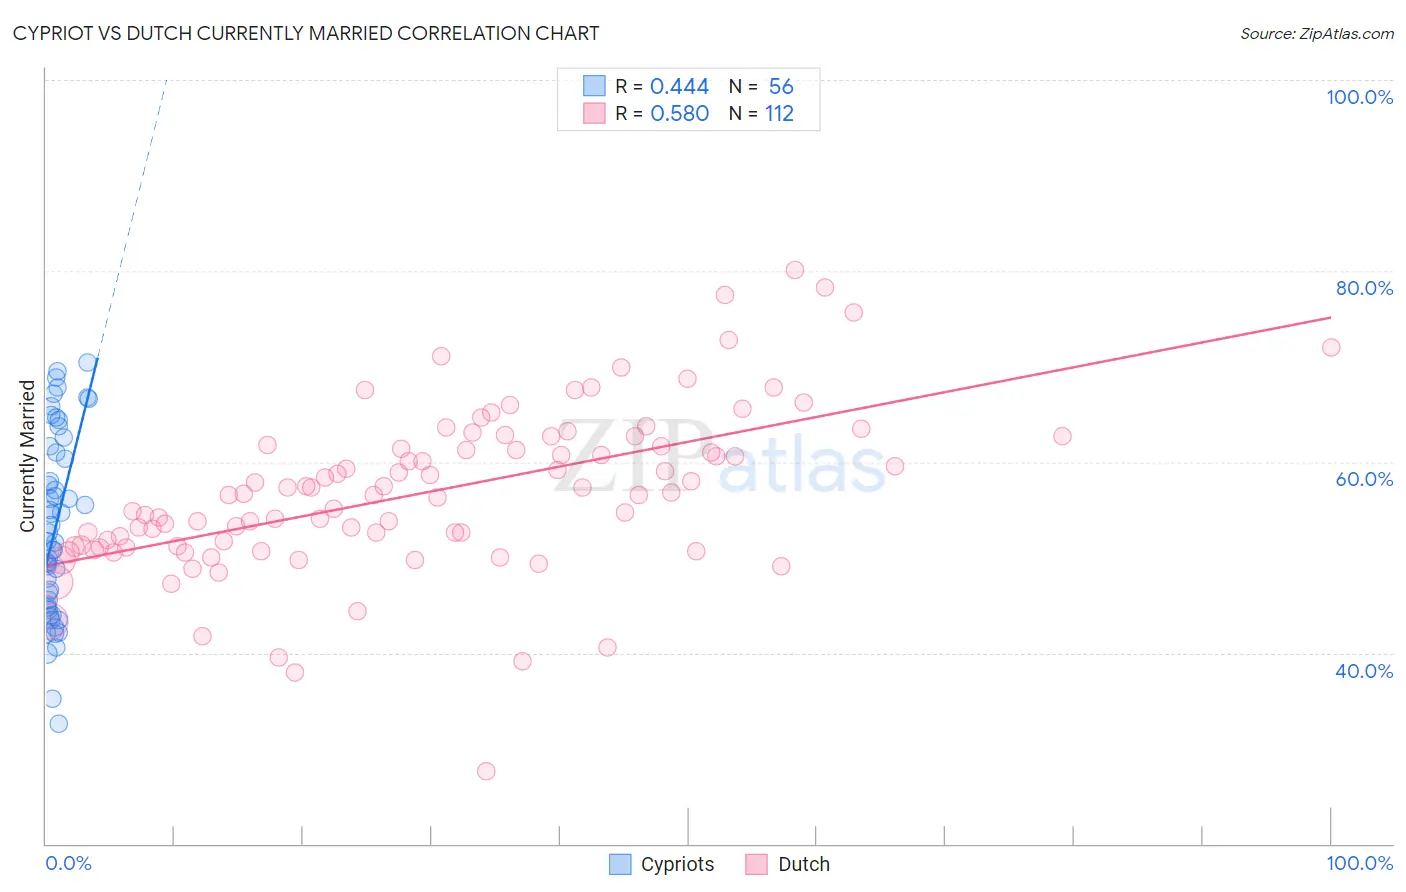
Cypriot vs Dutch Currently Married Correlation Chart
The statistical analysis conducted on geographies consisting of 61,862,826 people shows a moderate positive correlation between the proportion of Cypriots and percentage of population currently married in the United States with a correlation coefficient (R) of 0.444 and weighted average of 47.8%. Similarly, the statistical analysis conducted on geographies consisting of 554,255,721 people shows a substantial positive correlation between the proportion of Dutch and percentage of population currently married in the United States with a correlation coefficient (R) of 0.580 and weighted average of 49.6%, a difference of 3.8%.
Currently Married Correlation Summary
| Measurement | Cypriot | Dutch |
| Minimum | 32.6% | 27.6% |
| Maximum | 70.4% | 80.1% |
| Range | 37.8% | 52.5% |
| Mean | 53.2% | 56.8% |
| Median | 52.1% | 56.6% |
| Interquartile 25% (IQ1) | 44.9% | 51.2% |
| Interquartile 75% (IQ3) | 61.3% | 61.7% |
| Interquartile Range (IQR) | 16.4% | 10.6% |
| Standard Deviation (Sample) | 9.6% | 8.6% |
| Standard Deviation (Population) | 9.5% | 8.6% |
Similar Demographics by Currently Married
Demographics Similar to Cypriots by Currently Married
In terms of currently married, the demographic groups most similar to Cypriots are Serbian (47.8%, a difference of 0.020%), Turkish (47.8%, a difference of 0.030%), Immigrants from Germany (47.8%, a difference of 0.050%), Celtic (47.8%, a difference of 0.070%), and Immigrants from Singapore (47.8%, a difference of 0.070%).
| Demographics | Rating | Rank | Currently Married |
| Egyptians | 94.8 /100 | #96 | Exceptional 47.9% |
| Immigrants | Ukraine | 94.8 /100 | #97 | Exceptional 47.9% |
| Immigrants | China | 94.7 /100 | #98 | Exceptional 47.9% |
| Immigrants | Sweden | 94.3 /100 | #99 | Exceptional 47.8% |
| Celtics | 94.2 /100 | #100 | Exceptional 47.8% |
| Immigrants | Germany | 94.1 /100 | #101 | Exceptional 47.8% |
| Turks | 93.9 /100 | #102 | Exceptional 47.8% |
| Cypriots | 93.7 /100 | #103 | Exceptional 47.8% |
| Serbians | 93.6 /100 | #104 | Exceptional 47.8% |
| Immigrants | Singapore | 93.3 /100 | #105 | Exceptional 47.8% |
| Immigrants | Greece | 93.1 /100 | #106 | Exceptional 47.7% |
| Immigrants | Italy | 92.9 /100 | #107 | Exceptional 47.7% |
| Tsimshian | 92.4 /100 | #108 | Exceptional 47.7% |
| Immigrants | Egypt | 92.3 /100 | #109 | Exceptional 47.7% |
| Immigrants | Russia | 92.0 /100 | #110 | Exceptional 47.7% |
Demographics Similar to Dutch by Currently Married
In terms of currently married, the demographic groups most similar to Dutch are German (49.6%, a difference of 0.010%), Pennsylvania German (49.6%, a difference of 0.040%), Chinese (49.5%, a difference of 0.18%), Scandinavian (49.5%, a difference of 0.20%), and English (49.7%, a difference of 0.26%).
| Demographics | Rating | Rank | Currently Married |
| Norwegians | 100.0 /100 | #6 | Exceptional 50.2% |
| Immigrants | South Central Asia | 100.0 /100 | #7 | Exceptional 50.0% |
| Swedes | 100.0 /100 | #8 | Exceptional 50.0% |
| Czechs | 99.9 /100 | #9 | Exceptional 49.9% |
| Filipinos | 99.9 /100 | #10 | Exceptional 49.7% |
| English | 99.9 /100 | #11 | Exceptional 49.7% |
| Swiss | 99.9 /100 | #12 | Exceptional 49.7% |
| Dutch | 99.9 /100 | #13 | Exceptional 49.6% |
| Germans | 99.9 /100 | #14 | Exceptional 49.6% |
| Pennsylvania Germans | 99.9 /100 | #15 | Exceptional 49.6% |
| Chinese | 99.9 /100 | #16 | Exceptional 49.5% |
| Scandinavians | 99.9 /100 | #17 | Exceptional 49.5% |
| Immigrants | Scotland | 99.8 /100 | #18 | Exceptional 49.3% |
| Europeans | 99.8 /100 | #19 | Exceptional 49.3% |
| Luxembourgers | 99.8 /100 | #20 | Exceptional 49.3% |