Cypriot vs Yup'ik Family Households with Children
COMPARE
Cypriot
Yup'ik
Family Households with Children
Family Households with Children Comparison
Cypriots
Yup'ik
25.9%
FAMILY HOUSEHOLDS WITH CHILDREN
0.0/ 100
METRIC RATING
329th/ 347
METRIC RANK
37.0%
FAMILY HOUSEHOLDS WITH CHILDREN
100/ 100
METRIC RATING
1st/ 347
METRIC RANK
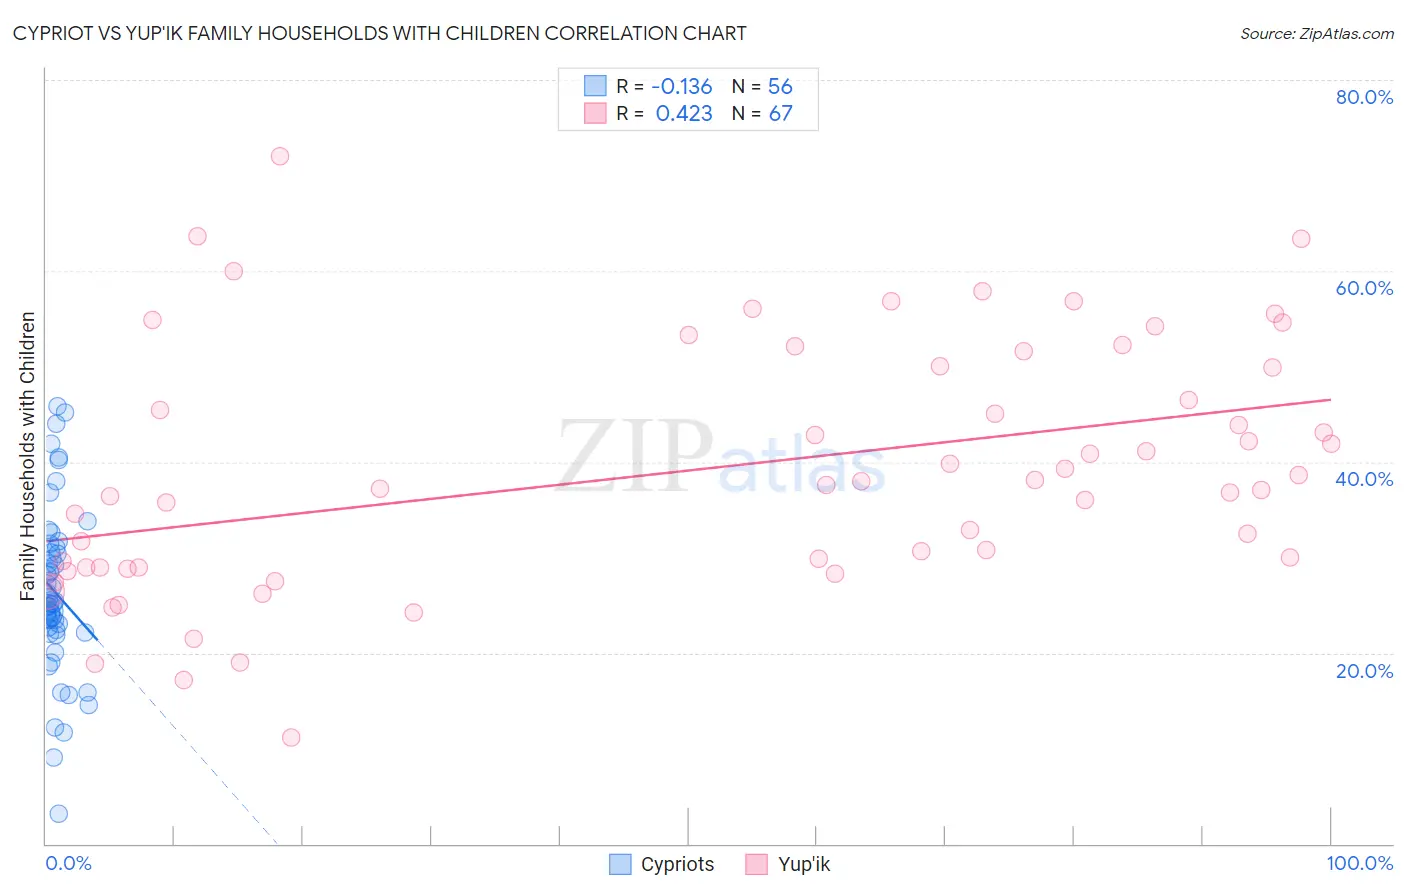
Cypriot vs Yup'ik Family Households with Children Correlation Chart
The statistical analysis conducted on geographies consisting of 61,838,668 people shows a poor negative correlation between the proportion of Cypriots and percentage of family households with children in the United States with a correlation coefficient (R) of -0.136 and weighted average of 25.9%. Similarly, the statistical analysis conducted on geographies consisting of 39,956,617 people shows a moderate positive correlation between the proportion of Yup'ik and percentage of family households with children in the United States with a correlation coefficient (R) of 0.423 and weighted average of 37.0%, a difference of 42.9%.
Family Households with Children Correlation Summary
| Measurement | Cypriot | Yup'ik |
| Minimum | 3.1% | 11.1% |
| Maximum | 45.8% | 72.0% |
| Range | 42.7% | 60.9% |
| Mean | 26.3% | 39.1% |
| Median | 25.1% | 37.6% |
| Interquartile 25% (IQ1) | 22.3% | 28.9% |
| Interquartile 75% (IQ3) | 30.8% | 50.0% |
| Interquartile Range (IQR) | 8.5% | 21.1% |
| Standard Deviation (Sample) | 8.8% | 12.9% |
| Standard Deviation (Population) | 8.7% | 12.8% |
Similar Demographics by Family Households with Children
Demographics Similar to Cypriots by Family Households with Children
In terms of family households with children, the demographic groups most similar to Cypriots are Immigrants from Albania (25.9%, a difference of 0.13%), Immigrants from Latvia (25.9%, a difference of 0.18%), Immigrants from Barbados (26.0%, a difference of 0.23%), Slovene (25.8%, a difference of 0.31%), and Immigrants from Ireland (26.0%, a difference of 0.33%).
| Demographics | Rating | Rank | Family Households with Children |
| Immigrants | Greece | 0.0 /100 | #322 | Tragic 26.0% |
| Immigrants | Australia | 0.0 /100 | #323 | Tragic 26.0% |
| Chinese | 0.0 /100 | #324 | Tragic 26.0% |
| Barbadians | 0.0 /100 | #325 | Tragic 26.0% |
| Immigrants | Ireland | 0.0 /100 | #326 | Tragic 26.0% |
| Immigrants | Barbados | 0.0 /100 | #327 | Tragic 26.0% |
| Immigrants | Albania | 0.0 /100 | #328 | Tragic 25.9% |
| Cypriots | 0.0 /100 | #329 | Tragic 25.9% |
| Immigrants | Latvia | 0.0 /100 | #330 | Tragic 25.9% |
| Slovenes | 0.0 /100 | #331 | Tragic 25.8% |
| Immigrants | Austria | 0.0 /100 | #332 | Tragic 25.8% |
| Immigrants | Switzerland | 0.0 /100 | #333 | Tragic 25.7% |
| Slovaks | 0.0 /100 | #334 | Tragic 25.7% |
| Immigrants | Croatia | 0.0 /100 | #335 | Tragic 25.7% |
| Immigrants | West Indies | 0.0 /100 | #336 | Tragic 25.7% |
Demographics Similar to Yup'ik by Family Households with Children
In terms of family households with children, the demographic groups most similar to Yup'ik are Inupiat (32.8%, a difference of 12.7%), Immigrants from Mexico (31.6%, a difference of 17.1%), Mexican (31.4%, a difference of 18.0%), Tongan (31.2%, a difference of 18.5%), and Immigrants from India (31.0%, a difference of 19.2%).
| Demographics | Rating | Rank | Family Households with Children |
| Yup'ik | 100 /100 | #1 | Exceptional 37.0% |
| Inupiat | 100 /100 | #2 | Exceptional 32.8% |
| Immigrants | Mexico | 100.0 /100 | #3 | Exceptional 31.6% |
| Mexicans | 100.0 /100 | #4 | Exceptional 31.4% |
| Tongans | 100.0 /100 | #5 | Exceptional 31.2% |
| Immigrants | India | 100.0 /100 | #6 | Exceptional 31.0% |
| Immigrants | Central America | 100.0 /100 | #7 | Exceptional 31.0% |
| Yakama | 100.0 /100 | #8 | Exceptional 30.8% |
| Thais | 100.0 /100 | #9 | Exceptional 30.6% |
| Immigrants | Fiji | 100.0 /100 | #10 | Exceptional 30.5% |
| Nepalese | 100.0 /100 | #11 | Exceptional 30.5% |
| Immigrants | Pakistan | 100.0 /100 | #12 | Exceptional 30.2% |
| Afghans | 100.0 /100 | #13 | Exceptional 30.2% |
| Bangladeshis | 100.0 /100 | #14 | Exceptional 30.1% |
| Immigrants | South Central Asia | 100.0 /100 | #15 | Exceptional 30.0% |