Cypriot vs Bangladeshi Family Households
COMPARE
Cypriot
Bangladeshi
Family Households
Family Households Comparison
Cypriots
Bangladeshis
63.2%
FAMILY HOUSEHOLDS
0.6/ 100
METRIC RATING
260th/ 347
METRIC RANK
64.3%
FAMILY HOUSEHOLDS
44.3/ 100
METRIC RATING
175th/ 347
METRIC RANK
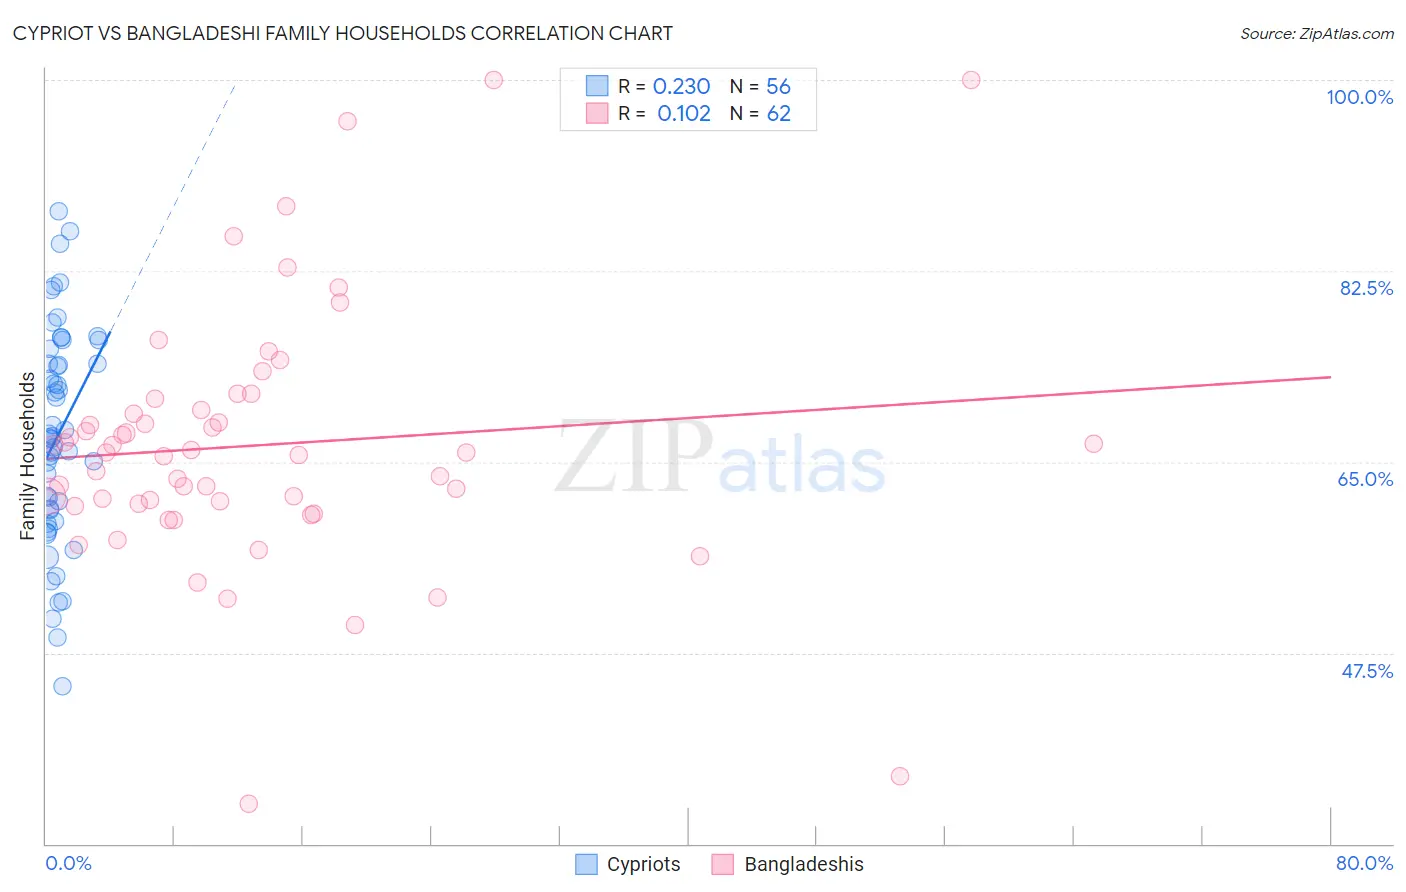
Cypriot vs Bangladeshi Family Households Correlation Chart
The statistical analysis conducted on geographies consisting of 61,857,015 people shows a weak positive correlation between the proportion of Cypriots and percentage of family households in the United States with a correlation coefficient (R) of 0.230 and weighted average of 63.2%. Similarly, the statistical analysis conducted on geographies consisting of 141,333,062 people shows a poor positive correlation between the proportion of Bangladeshis and percentage of family households in the United States with a correlation coefficient (R) of 0.102 and weighted average of 64.3%, a difference of 1.7%.
Family Households Correlation Summary
| Measurement | Cypriot | Bangladeshi |
| Minimum | 44.4% | 33.7% |
| Maximum | 87.9% | 100.0% |
| Range | 43.5% | 66.3% |
| Mean | 67.4% | 66.5% |
| Median | 67.3% | 65.9% |
| Interquartile 25% (IQ1) | 60.0% | 61.1% |
| Interquartile 75% (IQ3) | 74.7% | 69.8% |
| Interquartile Range (IQR) | 14.7% | 8.7% |
| Standard Deviation (Sample) | 9.9% | 11.9% |
| Standard Deviation (Population) | 9.8% | 11.8% |
Similar Demographics by Family Households
Demographics Similar to Cypriots by Family Households
In terms of family households, the demographic groups most similar to Cypriots are Immigrants from Western Europe (63.2%, a difference of 0.020%), Immigrants from Russia (63.2%, a difference of 0.020%), Immigrants from Barbados (63.2%, a difference of 0.030%), Immigrants from Ireland (63.2%, a difference of 0.030%), and Cheyenne (63.2%, a difference of 0.050%).
| Demographics | Rating | Rank | Family Households |
| Immigrants | Dominican Republic | 1.0 /100 | #253 | Tragic 63.3% |
| Slovaks | 1.0 /100 | #254 | Tragic 63.3% |
| Potawatomi | 1.0 /100 | #255 | Tragic 63.3% |
| Luxembourgers | 0.9 /100 | #256 | Tragic 63.3% |
| Icelanders | 0.8 /100 | #257 | Tragic 63.3% |
| Immigrants | Barbados | 0.7 /100 | #258 | Tragic 63.2% |
| Immigrants | Western Europe | 0.6 /100 | #259 | Tragic 63.2% |
| Cypriots | 0.6 /100 | #260 | Tragic 63.2% |
| Immigrants | Russia | 0.6 /100 | #261 | Tragic 63.2% |
| Immigrants | Ireland | 0.6 /100 | #262 | Tragic 63.2% |
| Cheyenne | 0.5 /100 | #263 | Tragic 63.2% |
| Kenyans | 0.5 /100 | #264 | Tragic 63.2% |
| Colville | 0.5 /100 | #265 | Tragic 63.2% |
| Immigrants | Western Africa | 0.5 /100 | #266 | Tragic 63.1% |
| Israelis | 0.4 /100 | #267 | Tragic 63.1% |
Demographics Similar to Bangladeshis by Family Households
In terms of family households, the demographic groups most similar to Bangladeshis are Vietnamese (64.2%, a difference of 0.010%), Immigrants from Micronesia (64.2%, a difference of 0.030%), Jamaican (64.2%, a difference of 0.050%), Immigrants from Germany (64.3%, a difference of 0.080%), and Immigrants from Ukraine (64.2%, a difference of 0.080%).
| Demographics | Rating | Rank | Family Households |
| Hondurans | 57.5 /100 | #168 | Average 64.4% |
| Iraqis | 56.0 /100 | #169 | Average 64.4% |
| Armenians | 55.9 /100 | #170 | Average 64.4% |
| Ute | 54.6 /100 | #171 | Average 64.3% |
| Dutch West Indians | 53.9 /100 | #172 | Average 64.3% |
| Immigrants | Sierra Leone | 52.5 /100 | #173 | Average 64.3% |
| Immigrants | Germany | 50.0 /100 | #174 | Average 64.3% |
| Bangladeshis | 44.3 /100 | #175 | Average 64.3% |
| Vietnamese | 43.6 /100 | #176 | Average 64.2% |
| Immigrants | Micronesia | 42.3 /100 | #177 | Average 64.2% |
| Jamaicans | 40.6 /100 | #178 | Average 64.2% |
| Immigrants | Ukraine | 38.2 /100 | #179 | Fair 64.2% |
| Immigrants | Honduras | 35.0 /100 | #180 | Fair 64.2% |
| Immigrants | Trinidad and Tobago | 34.9 /100 | #181 | Fair 64.2% |
| Ukrainians | 34.6 /100 | #182 | Fair 64.2% |