Luxembourger vs Carpatho Rusyn Currently Married
COMPARE
Luxembourger
Carpatho Rusyn
Currently Married
Currently Married Comparison
Luxembourgers
Carpatho Rusyns
49.3%
CURRENTLY MARRIED
99.8/ 100
METRIC RATING
20th/ 347
METRIC RANK
47.0%
CURRENTLY MARRIED
72.6/ 100
METRIC RATING
146th/ 347
METRIC RANK
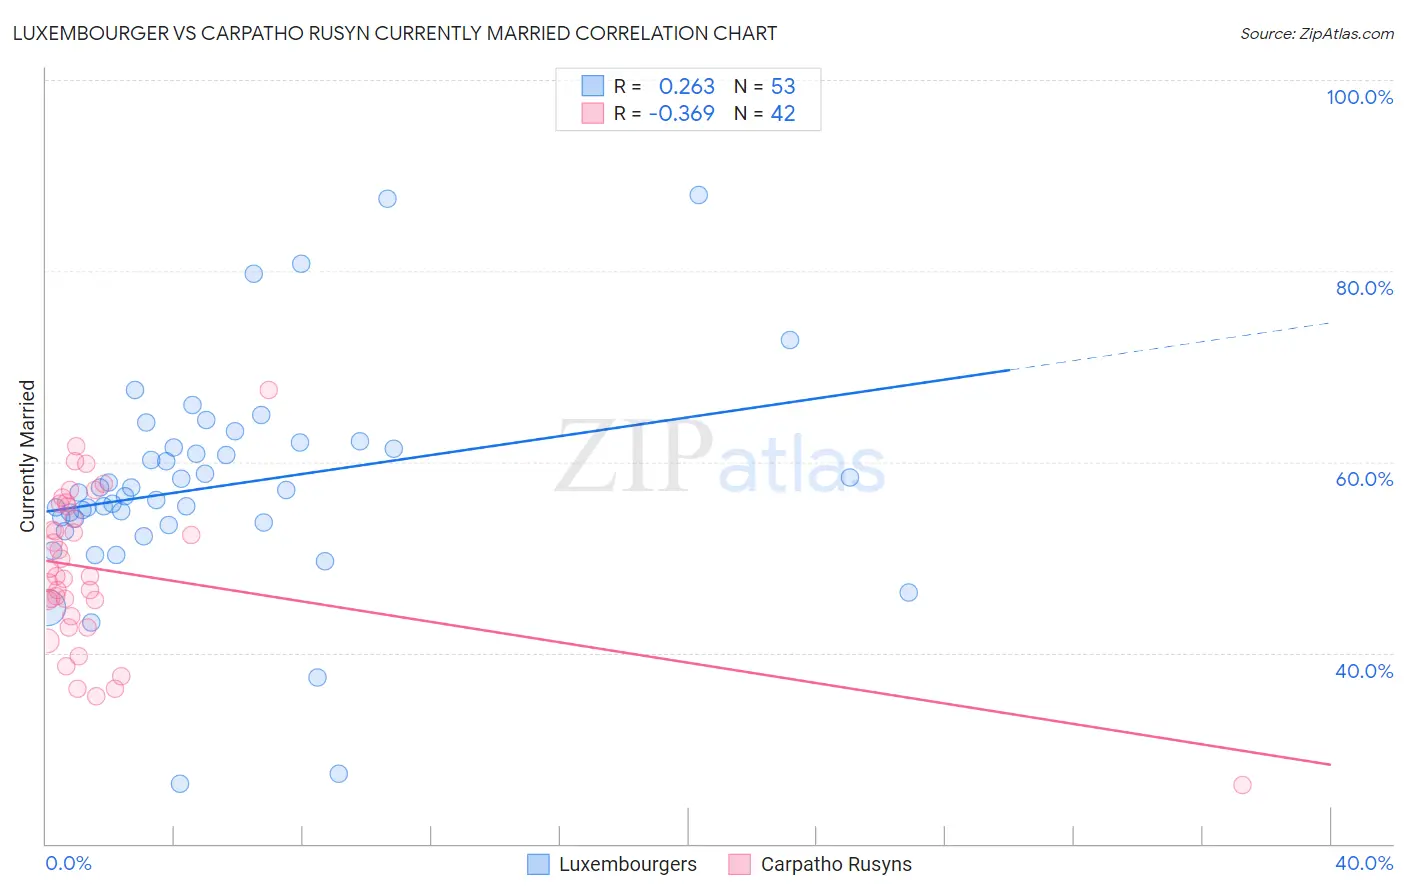
Luxembourger vs Carpatho Rusyn Currently Married Correlation Chart
The statistical analysis conducted on geographies consisting of 144,673,478 people shows a weak positive correlation between the proportion of Luxembourgers and percentage of population currently married in the United States with a correlation coefficient (R) of 0.263 and weighted average of 49.3%. Similarly, the statistical analysis conducted on geographies consisting of 58,871,690 people shows a mild negative correlation between the proportion of Carpatho Rusyns and percentage of population currently married in the United States with a correlation coefficient (R) of -0.369 and weighted average of 47.0%, a difference of 4.7%.
Currently Married Correlation Summary
| Measurement | Luxembourger | Carpatho Rusyn |
| Minimum | 26.3% | 26.2% |
| Maximum | 88.0% | 67.5% |
| Range | 61.7% | 41.3% |
| Mean | 57.5% | 48.6% |
| Median | 56.7% | 48.0% |
| Interquartile 25% (IQ1) | 53.5% | 43.8% |
| Interquartile 75% (IQ3) | 61.7% | 55.3% |
| Interquartile Range (IQR) | 8.2% | 11.5% |
| Standard Deviation (Sample) | 11.4% | 8.3% |
| Standard Deviation (Population) | 11.2% | 8.2% |
Similar Demographics by Currently Married
Demographics Similar to Luxembourgers by Currently Married
In terms of currently married, the demographic groups most similar to Luxembourgers are Scottish (49.2%, a difference of 0.11%), European (49.3%, a difference of 0.14%), Immigrants from Scotland (49.3%, a difference of 0.15%), Bulgarian (49.1%, a difference of 0.33%), and Scandinavian (49.5%, a difference of 0.44%).
| Demographics | Rating | Rank | Currently Married |
| Dutch | 99.9 /100 | #13 | Exceptional 49.6% |
| Germans | 99.9 /100 | #14 | Exceptional 49.6% |
| Pennsylvania Germans | 99.9 /100 | #15 | Exceptional 49.6% |
| Chinese | 99.9 /100 | #16 | Exceptional 49.5% |
| Scandinavians | 99.9 /100 | #17 | Exceptional 49.5% |
| Immigrants | Scotland | 99.8 /100 | #18 | Exceptional 49.3% |
| Europeans | 99.8 /100 | #19 | Exceptional 49.3% |
| Luxembourgers | 99.8 /100 | #20 | Exceptional 49.3% |
| Scottish | 99.8 /100 | #21 | Exceptional 49.2% |
| Bulgarians | 99.7 /100 | #22 | Exceptional 49.1% |
| Immigrants | Pakistan | 99.7 /100 | #23 | Exceptional 49.1% |
| Lithuanians | 99.6 /100 | #24 | Exceptional 49.0% |
| Maltese | 99.6 /100 | #25 | Exceptional 49.0% |
| Immigrants | Korea | 99.6 /100 | #26 | Exceptional 49.0% |
| Burmese | 99.6 /100 | #27 | Exceptional 48.9% |
Demographics Similar to Carpatho Rusyns by Currently Married
In terms of currently married, the demographic groups most similar to Carpatho Rusyns are Immigrants from South Eastern Asia (47.1%, a difference of 0.010%), Immigrants from Argentina (47.0%, a difference of 0.030%), Hmong (47.1%, a difference of 0.040%), Guamanian/Chamorro (47.1%, a difference of 0.070%), and Venezuelan (47.1%, a difference of 0.080%).
| Demographics | Rating | Rank | Currently Married |
| Yugoslavians | 77.4 /100 | #139 | Good 47.2% |
| Cajuns | 75.3 /100 | #140 | Good 47.1% |
| Venezuelans | 74.4 /100 | #141 | Good 47.1% |
| Argentineans | 74.4 /100 | #142 | Good 47.1% |
| Guamanians/Chamorros | 74.2 /100 | #143 | Good 47.1% |
| Hmong | 73.4 /100 | #144 | Good 47.1% |
| Immigrants | South Eastern Asia | 72.9 /100 | #145 | Good 47.1% |
| Carpatho Rusyns | 72.6 /100 | #146 | Good 47.0% |
| Immigrants | Argentina | 72.0 /100 | #147 | Good 47.0% |
| Cambodians | 70.4 /100 | #148 | Good 47.0% |
| Zimbabweans | 70.1 /100 | #149 | Good 47.0% |
| Immigrants | Turkey | 70.0 /100 | #150 | Good 47.0% |
| Chileans | 69.8 /100 | #151 | Good 47.0% |
| Immigrants | Serbia | 68.8 /100 | #152 | Good 47.0% |
| Immigrants | Venezuela | 68.6 /100 | #153 | Good 47.0% |