Colombian vs Carpatho Rusyn Currently Married
COMPARE
Colombian
Carpatho Rusyn
Currently Married
Currently Married Comparison
Colombians
Carpatho Rusyns
46.3%
CURRENTLY MARRIED
31.8/ 100
METRIC RATING
188th/ 347
METRIC RANK
47.0%
CURRENTLY MARRIED
72.6/ 100
METRIC RATING
146th/ 347
METRIC RANK
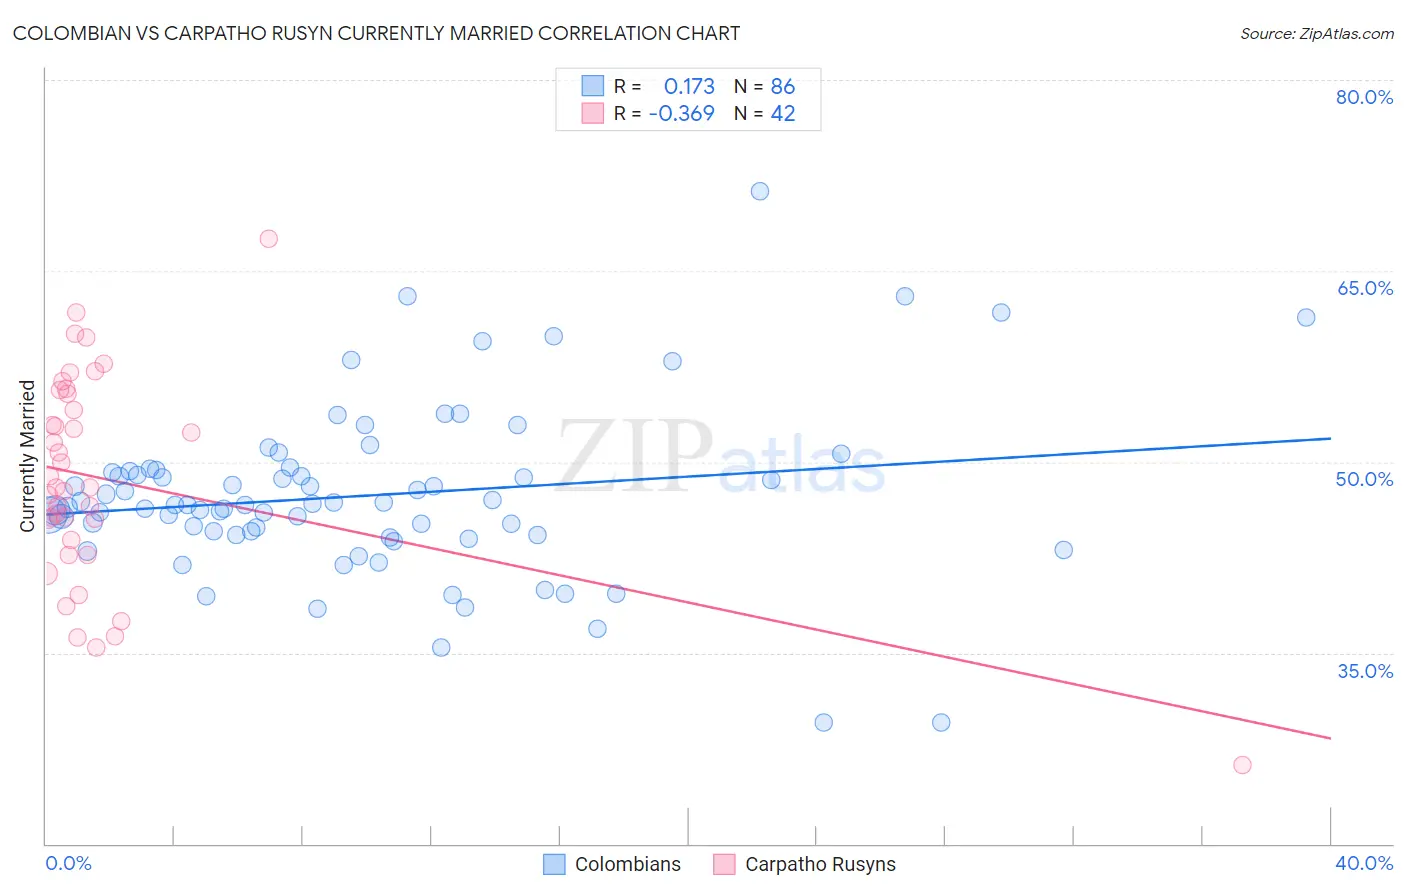
Colombian vs Carpatho Rusyn Currently Married Correlation Chart
The statistical analysis conducted on geographies consisting of 419,624,806 people shows a poor positive correlation between the proportion of Colombians and percentage of population currently married in the United States with a correlation coefficient (R) of 0.173 and weighted average of 46.3%. Similarly, the statistical analysis conducted on geographies consisting of 58,871,690 people shows a mild negative correlation between the proportion of Carpatho Rusyns and percentage of population currently married in the United States with a correlation coefficient (R) of -0.369 and weighted average of 47.0%, a difference of 1.6%.
Currently Married Correlation Summary
| Measurement | Colombian | Carpatho Rusyn |
| Minimum | 29.5% | 26.2% |
| Maximum | 71.3% | 67.5% |
| Range | 41.8% | 41.3% |
| Mean | 47.4% | 48.6% |
| Median | 46.6% | 48.0% |
| Interquartile 25% (IQ1) | 44.3% | 43.8% |
| Interquartile 75% (IQ3) | 49.3% | 55.3% |
| Interquartile Range (IQR) | 5.0% | 11.5% |
| Standard Deviation (Sample) | 6.8% | 8.3% |
| Standard Deviation (Population) | 6.7% | 8.2% |
Similar Demographics by Currently Married
Demographics Similar to Colombians by Currently Married
In terms of currently married, the demographic groups most similar to Colombians are Fijian (46.3%, a difference of 0.060%), Choctaw (46.3%, a difference of 0.12%), Immigrants from Peru (46.4%, a difference of 0.14%), Immigrants from France (46.2%, a difference of 0.18%), and Immigrants from Chile (46.4%, a difference of 0.20%).
| Demographics | Rating | Rank | Currently Married |
| Ottawa | 43.0 /100 | #181 | Average 46.5% |
| Potawatomi | 41.9 /100 | #182 | Average 46.5% |
| Immigrants | Northern Africa | 39.7 /100 | #183 | Fair 46.5% |
| Brazilians | 39.3 /100 | #184 | Fair 46.4% |
| Mongolians | 37.6 /100 | #185 | Fair 46.4% |
| Immigrants | Chile | 36.8 /100 | #186 | Fair 46.4% |
| Immigrants | Peru | 35.3 /100 | #187 | Fair 46.4% |
| Colombians | 31.8 /100 | #188 | Fair 46.3% |
| Fijians | 30.3 /100 | #189 | Fair 46.3% |
| Choctaw | 29.1 /100 | #190 | Fair 46.3% |
| Immigrants | France | 27.7 /100 | #191 | Fair 46.2% |
| Soviet Union | 25.7 /100 | #192 | Fair 46.2% |
| Immigrants | Fiji | 25.0 /100 | #193 | Fair 46.2% |
| South Americans | 23.8 /100 | #194 | Fair 46.1% |
| Immigrants | Nepal | 23.7 /100 | #195 | Fair 46.1% |
Demographics Similar to Carpatho Rusyns by Currently Married
In terms of currently married, the demographic groups most similar to Carpatho Rusyns are Immigrants from South Eastern Asia (47.1%, a difference of 0.010%), Immigrants from Argentina (47.0%, a difference of 0.030%), Hmong (47.1%, a difference of 0.040%), Guamanian/Chamorro (47.1%, a difference of 0.070%), and Venezuelan (47.1%, a difference of 0.080%).
| Demographics | Rating | Rank | Currently Married |
| Yugoslavians | 77.4 /100 | #139 | Good 47.2% |
| Cajuns | 75.3 /100 | #140 | Good 47.1% |
| Venezuelans | 74.4 /100 | #141 | Good 47.1% |
| Argentineans | 74.4 /100 | #142 | Good 47.1% |
| Guamanians/Chamorros | 74.2 /100 | #143 | Good 47.1% |
| Hmong | 73.4 /100 | #144 | Good 47.1% |
| Immigrants | South Eastern Asia | 72.9 /100 | #145 | Good 47.1% |
| Carpatho Rusyns | 72.6 /100 | #146 | Good 47.0% |
| Immigrants | Argentina | 72.0 /100 | #147 | Good 47.0% |
| Cambodians | 70.4 /100 | #148 | Good 47.0% |
| Zimbabweans | 70.1 /100 | #149 | Good 47.0% |
| Immigrants | Turkey | 70.0 /100 | #150 | Good 47.0% |
| Chileans | 69.8 /100 | #151 | Good 47.0% |
| Immigrants | Serbia | 68.8 /100 | #152 | Good 47.0% |
| Immigrants | Venezuela | 68.6 /100 | #153 | Good 47.0% |