Cuban vs Inupiat Unemployment Among Ages 30 to 34 years
COMPARE
Cuban
Inupiat
Unemployment Among Ages 30 to 34 years
Unemployment Among Ages 30 to 34 years Comparison
Cubans
Inupiat
5.1%
UNEMPLOYMENT AMONG AGES 30 TO 34 YEARS
98.1/ 100
METRIC RATING
53rd/ 347
METRIC RANK
10.8%
UNEMPLOYMENT AMONG AGES 30 TO 34 YEARS
0.0/ 100
METRIC RATING
343rd/ 347
METRIC RANK
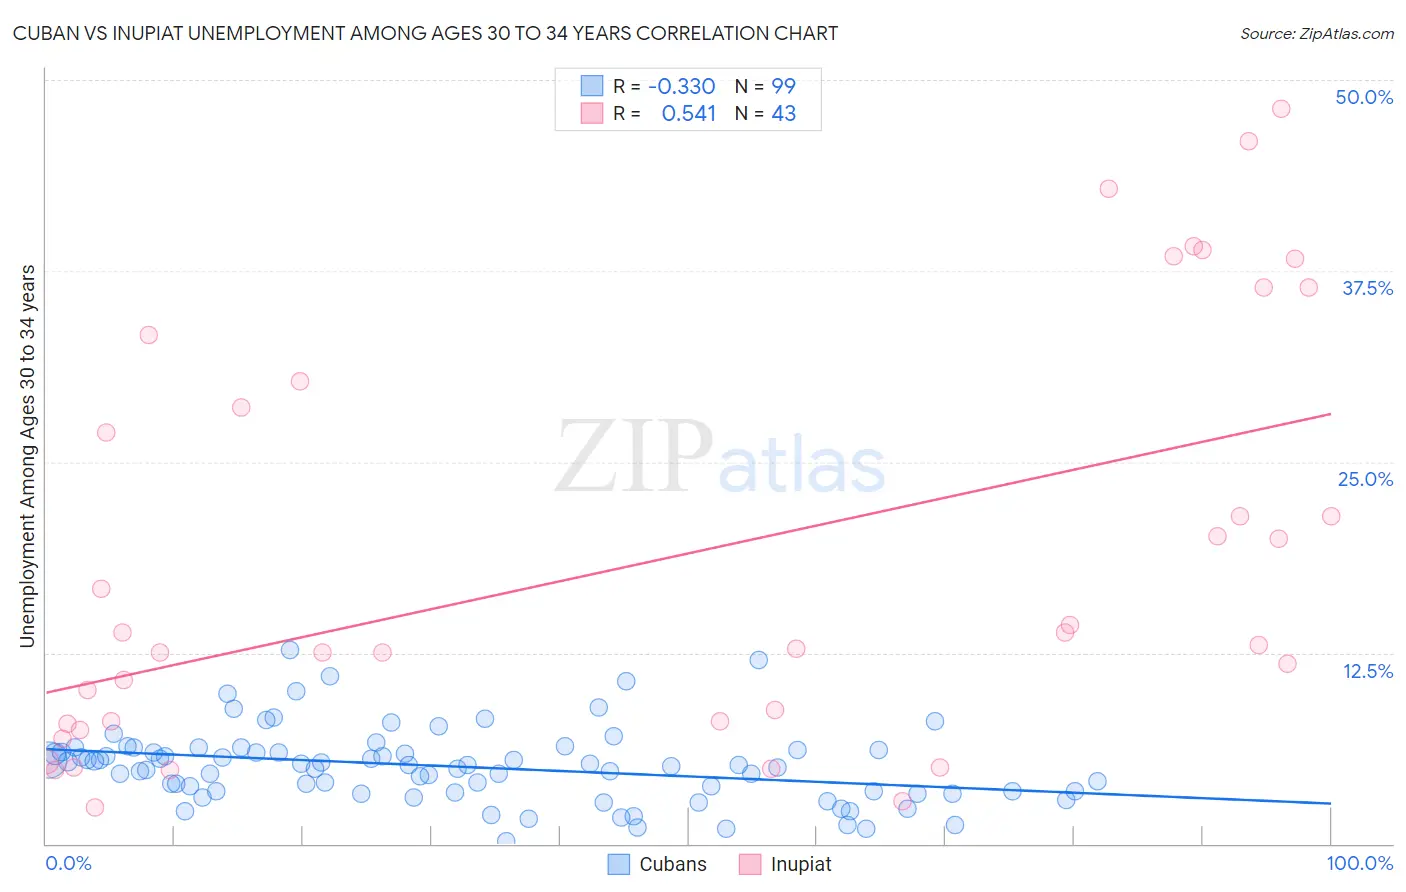
Cuban vs Inupiat Unemployment Among Ages 30 to 34 years Correlation Chart
The statistical analysis conducted on geographies consisting of 419,532,722 people shows a mild negative correlation between the proportion of Cubans and unemployment rate among population between the ages 30 and 34 in the United States with a correlation coefficient (R) of -0.330 and weighted average of 5.1%. Similarly, the statistical analysis conducted on geographies consisting of 94,650,433 people shows a substantial positive correlation between the proportion of Inupiat and unemployment rate among population between the ages 30 and 34 in the United States with a correlation coefficient (R) of 0.541 and weighted average of 10.8%, a difference of 112.7%.
Unemployment Among Ages 30 to 34 years Correlation Summary
| Measurement | Cuban | Inupiat |
| Minimum | 0.20% | 2.4% |
| Maximum | 12.7% | 48.1% |
| Range | 12.5% | 45.7% |
| Mean | 5.1% | 18.7% |
| Median | 5.1% | 13.0% |
| Interquartile 25% (IQ1) | 3.4% | 7.9% |
| Interquartile 75% (IQ3) | 6.1% | 30.3% |
| Interquartile Range (IQR) | 2.7% | 22.4% |
| Standard Deviation (Sample) | 2.4% | 13.6% |
| Standard Deviation (Population) | 2.4% | 13.4% |
Similar Demographics by Unemployment Among Ages 30 to 34 years
Demographics Similar to Cubans by Unemployment Among Ages 30 to 34 years
In terms of unemployment among ages 30 to 34 years, the demographic groups most similar to Cubans are Immigrants from Burma/Myanmar (5.1%, a difference of 0.050%), Turkish (5.1%, a difference of 0.090%), Puget Sound Salish (5.1%, a difference of 0.12%), Immigrants from Morocco (5.1%, a difference of 0.18%), and Immigrants from Malaysia (5.1%, a difference of 0.19%).
| Demographics | Rating | Rank | Unemployment Among Ages 30 to 34 years |
| Immigrants | Congo | 98.4 /100 | #46 | Exceptional 5.1% |
| Cypriots | 98.4 /100 | #47 | Exceptional 5.1% |
| Assyrians/Chaldeans/Syriacs | 98.4 /100 | #48 | Exceptional 5.1% |
| Immigrants | Malaysia | 98.3 /100 | #49 | Exceptional 5.1% |
| Puget Sound Salish | 98.2 /100 | #50 | Exceptional 5.1% |
| Turks | 98.2 /100 | #51 | Exceptional 5.1% |
| Immigrants | Burma/Myanmar | 98.1 /100 | #52 | Exceptional 5.1% |
| Cubans | 98.1 /100 | #53 | Exceptional 5.1% |
| Immigrants | Morocco | 97.9 /100 | #54 | Exceptional 5.1% |
| Chinese | 97.7 /100 | #55 | Exceptional 5.1% |
| Immigrants | Serbia | 97.4 /100 | #56 | Exceptional 5.1% |
| Immigrants | China | 97.2 /100 | #57 | Exceptional 5.1% |
| Asians | 97.2 /100 | #58 | Exceptional 5.1% |
| Swedes | 97.1 /100 | #59 | Exceptional 5.1% |
| Immigrants | Somalia | 97.1 /100 | #60 | Exceptional 5.1% |
Demographics Similar to Inupiat by Unemployment Among Ages 30 to 34 years
In terms of unemployment among ages 30 to 34 years, the demographic groups most similar to Inupiat are Yuman (10.6%, a difference of 2.1%), Navajo (10.6%, a difference of 2.5%), Crow (10.3%, a difference of 4.6%), Tohono O'odham (9.8%, a difference of 10.1%), and Hopi (11.9%, a difference of 10.3%).
| Demographics | Rating | Rank | Unemployment Among Ages 30 to 34 years |
| Pueblo | 0.0 /100 | #333 | Tragic 8.3% |
| Alaska Natives | 0.0 /100 | #334 | Tragic 8.5% |
| Puerto Ricans | 0.0 /100 | #335 | Tragic 8.9% |
| Colville | 0.0 /100 | #336 | Tragic 9.0% |
| Pima | 0.0 /100 | #337 | Tragic 9.6% |
| Yakama | 0.0 /100 | #338 | Tragic 9.8% |
| Tohono O'odham | 0.0 /100 | #339 | Tragic 9.8% |
| Crow | 0.0 /100 | #340 | Tragic 10.3% |
| Navajo | 0.0 /100 | #341 | Tragic 10.6% |
| Yuman | 0.0 /100 | #342 | Tragic 10.6% |
| Inupiat | 0.0 /100 | #343 | Tragic 10.8% |
| Hopi | 0.0 /100 | #344 | Tragic 11.9% |
| Arapaho | 0.0 /100 | #345 | Tragic 12.8% |
| Tsimshian | 0.0 /100 | #346 | Tragic 13.8% |
| Yup'ik | 0.0 /100 | #347 | Tragic 18.5% |