Cuban vs Argentinean Single Father Households
COMPARE
Cuban
Argentinean
Single Father Households
Single Father Households Comparison
Cubans
Argentineans
2.6%
SINGLE FATHER HOUSEHOLDS
0.3/ 100
METRIC RATING
269th/ 347
METRIC RANK
2.1%
SINGLE FATHER HOUSEHOLDS
98.9/ 100
METRIC RATING
102nd/ 347
METRIC RANK
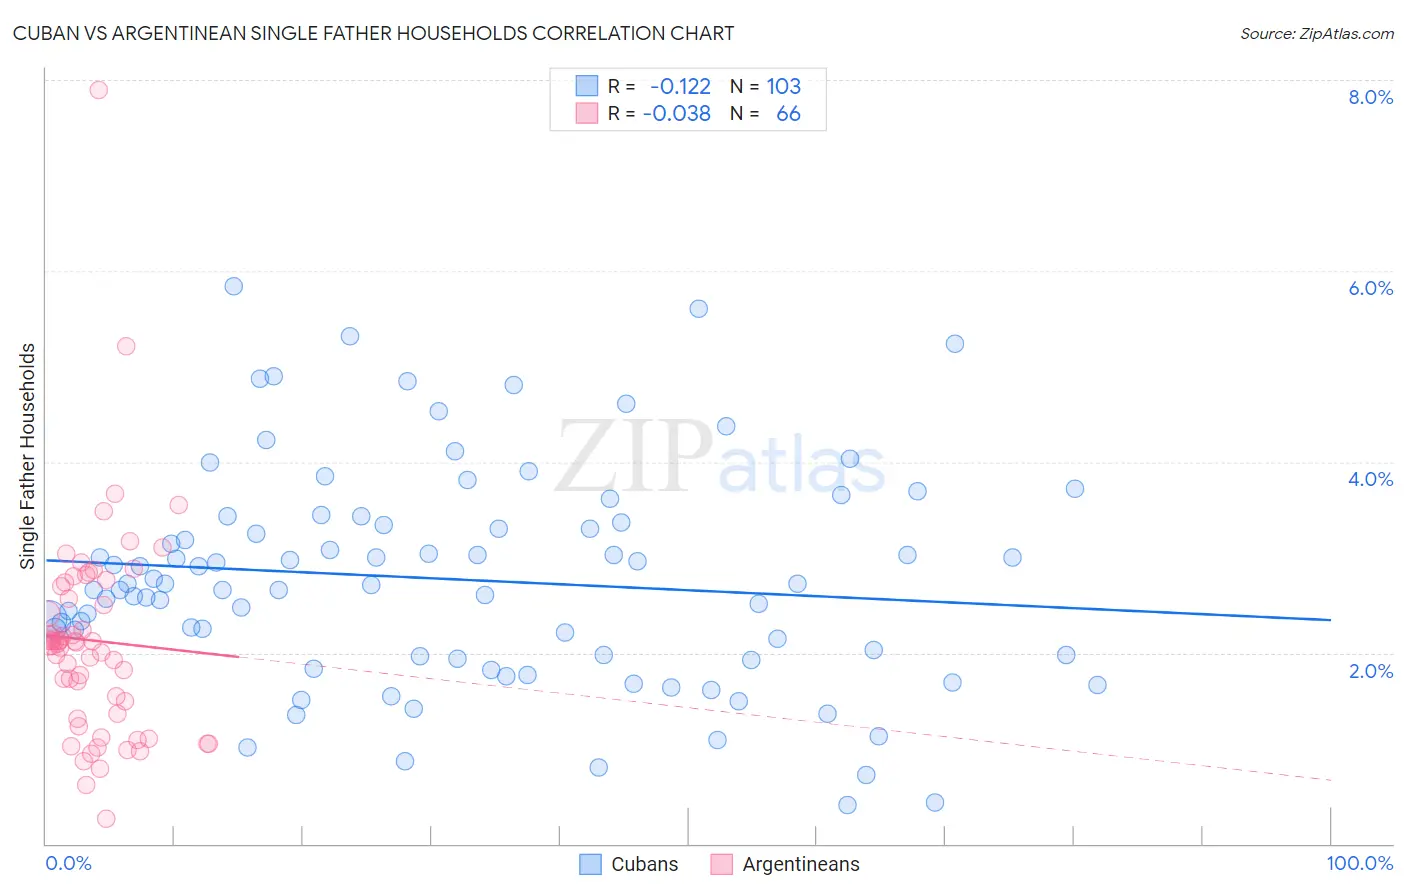
Cuban vs Argentinean Single Father Households Correlation Chart
The statistical analysis conducted on geographies consisting of 444,378,615 people shows a poor negative correlation between the proportion of Cubans and percentage of single father households in the United States with a correlation coefficient (R) of -0.122 and weighted average of 2.6%. Similarly, the statistical analysis conducted on geographies consisting of 295,652,417 people shows no correlation between the proportion of Argentineans and percentage of single father households in the United States with a correlation coefficient (R) of -0.038 and weighted average of 2.1%, a difference of 20.7%.
Single Father Households Correlation Summary
| Measurement | Cuban | Argentinean |
| Minimum | 0.41% | 0.26% |
| Maximum | 5.8% | 7.9% |
| Range | 5.4% | 7.6% |
| Mean | 2.8% | 2.1% |
| Median | 2.7% | 2.1% |
| Interquartile 25% (IQ1) | 2.0% | 1.4% |
| Interquartile 75% (IQ3) | 3.4% | 2.7% |
| Interquartile Range (IQR) | 1.4% | 1.3% |
| Standard Deviation (Sample) | 1.1% | 1.1% |
| Standard Deviation (Population) | 1.1% | 1.1% |
Similar Demographics by Single Father Households
Demographics Similar to Cubans by Single Father Households
In terms of single father households, the demographic groups most similar to Cubans are Seminole (2.6%, a difference of 0.14%), Haitian (2.6%, a difference of 0.34%), Guamanian/Chamorro (2.6%, a difference of 0.38%), Creek (2.6%, a difference of 0.50%), and Belizean (2.6%, a difference of 0.50%).
| Demographics | Rating | Rank | Single Father Households |
| Immigrants | Liberia | 0.8 /100 | #262 | Tragic 2.5% |
| Dominicans | 0.8 /100 | #263 | Tragic 2.5% |
| Indonesians | 0.5 /100 | #264 | Tragic 2.6% |
| Immigrants | Micronesia | 0.5 /100 | #265 | Tragic 2.6% |
| French American Indians | 0.5 /100 | #266 | Tragic 2.6% |
| Guamanians/Chamorros | 0.4 /100 | #267 | Tragic 2.6% |
| Haitians | 0.4 /100 | #268 | Tragic 2.6% |
| Cubans | 0.3 /100 | #269 | Tragic 2.6% |
| Seminole | 0.3 /100 | #270 | Tragic 2.6% |
| Creek | 0.2 /100 | #271 | Tragic 2.6% |
| Belizeans | 0.2 /100 | #272 | Tragic 2.6% |
| Iroquois | 0.2 /100 | #273 | Tragic 2.6% |
| Puerto Ricans | 0.2 /100 | #274 | Tragic 2.6% |
| Immigrants | Dominican Republic | 0.2 /100 | #275 | Tragic 2.6% |
| Immigrants | Haiti | 0.1 /100 | #276 | Tragic 2.6% |
Demographics Similar to Argentineans by Single Father Households
In terms of single father households, the demographic groups most similar to Argentineans are Lebanese (2.1%, a difference of 0.020%), Immigrants from Western Europe (2.1%, a difference of 0.030%), Alsatian (2.1%, a difference of 0.040%), Immigrants from Northern Africa (2.1%, a difference of 0.18%), and South African (2.1%, a difference of 0.33%).
| Demographics | Rating | Rank | Single Father Households |
| Bermudans | 99.2 /100 | #95 | Exceptional 2.1% |
| Arabs | 99.2 /100 | #96 | Exceptional 2.1% |
| Immigrants | Moldova | 99.1 /100 | #97 | Exceptional 2.1% |
| Guyanese | 99.1 /100 | #98 | Exceptional 2.1% |
| South Africans | 99.1 /100 | #99 | Exceptional 2.1% |
| Immigrants | Northern Africa | 99.0 /100 | #100 | Exceptional 2.1% |
| Immigrants | Western Europe | 98.9 /100 | #101 | Exceptional 2.1% |
| Argentineans | 98.9 /100 | #102 | Exceptional 2.1% |
| Lebanese | 98.9 /100 | #103 | Exceptional 2.1% |
| Alsatians | 98.9 /100 | #104 | Exceptional 2.1% |
| Palestinians | 98.6 /100 | #105 | Exceptional 2.2% |
| Immigrants | Southern Europe | 98.6 /100 | #106 | Exceptional 2.2% |
| Slovenes | 98.5 /100 | #107 | Exceptional 2.2% |
| Immigrants | Netherlands | 98.5 /100 | #108 | Exceptional 2.2% |
| Barbadians | 98.4 /100 | #109 | Exceptional 2.2% |