Cuban vs Immigrants from Africa 7th Grade
COMPARE
Cuban
Immigrants from Africa
7th Grade
7th Grade Comparison
Cubans
Immigrants from Africa
94.6%
7TH GRADE
0.0/ 100
METRIC RATING
296th/ 347
METRIC RANK
95.5%
7TH GRADE
2.7/ 100
METRIC RATING
235th/ 347
METRIC RANK
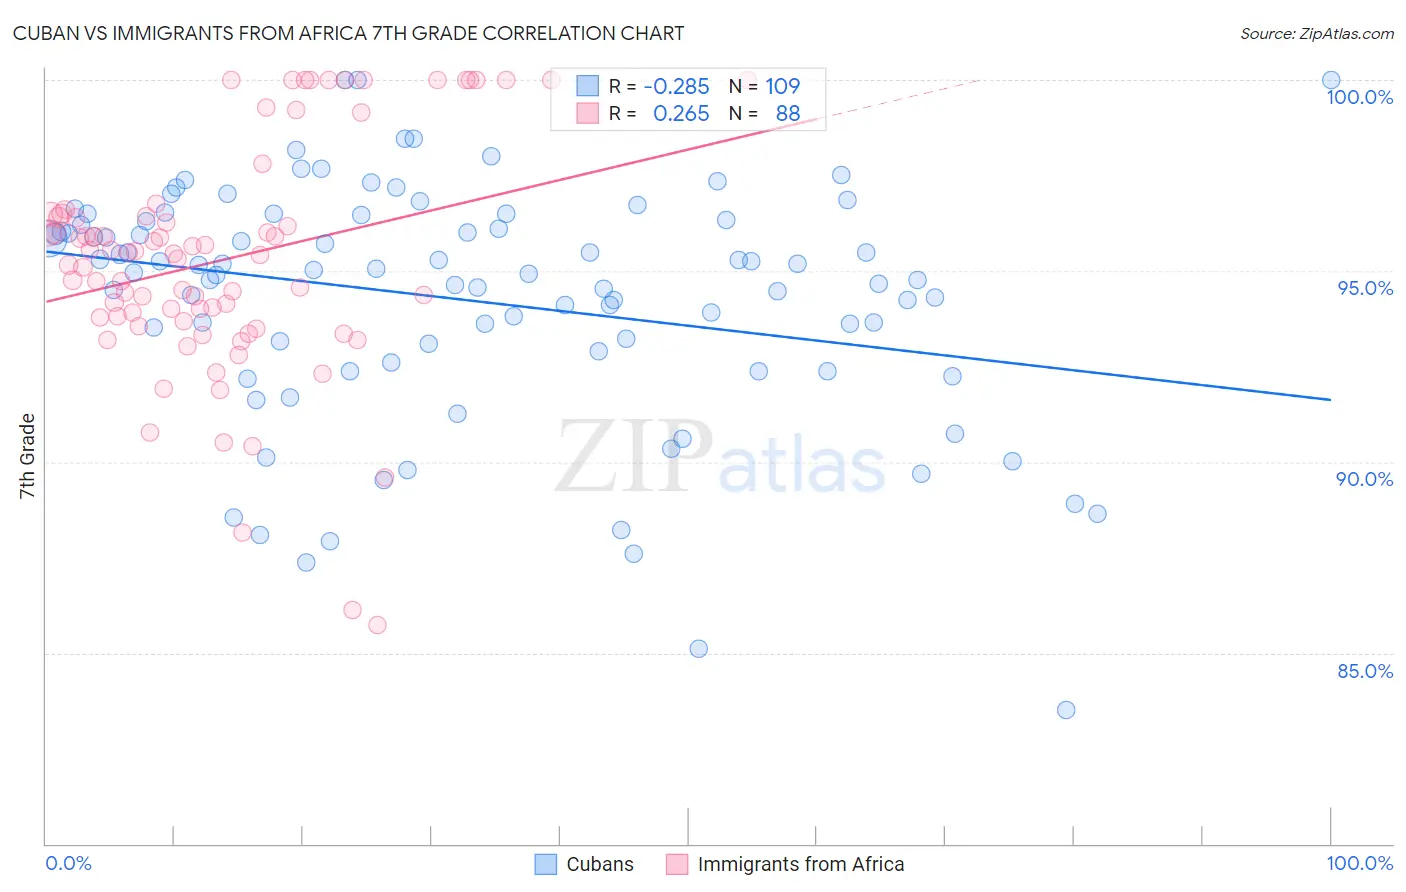
Cuban vs Immigrants from Africa 7th Grade Correlation Chart
The statistical analysis conducted on geographies consisting of 449,368,946 people shows a weak negative correlation between the proportion of Cubans and percentage of population with at least 7th grade education in the United States with a correlation coefficient (R) of -0.285 and weighted average of 94.6%. Similarly, the statistical analysis conducted on geographies consisting of 469,408,495 people shows a weak positive correlation between the proportion of Immigrants from Africa and percentage of population with at least 7th grade education in the United States with a correlation coefficient (R) of 0.265 and weighted average of 95.5%, a difference of 0.94%.
7th Grade Correlation Summary
| Measurement | Cuban | Immigrants from Africa |
| Minimum | 83.5% | 85.7% |
| Maximum | 100.0% | 100.0% |
| Range | 16.5% | 14.3% |
| Mean | 94.2% | 95.3% |
| Median | 94.9% | 95.4% |
| Interquartile 25% (IQ1) | 92.7% | 93.7% |
| Interquartile 75% (IQ3) | 96.3% | 96.5% |
| Interquartile Range (IQR) | 3.6% | 2.7% |
| Standard Deviation (Sample) | 3.1% | 3.1% |
| Standard Deviation (Population) | 3.1% | 3.0% |
Similar Demographics by 7th Grade
Demographics Similar to Cubans by 7th Grade
In terms of 7th grade, the demographic groups most similar to Cubans are Yaqui (94.6%, a difference of 0.010%), Haitian (94.7%, a difference of 0.040%), Immigrants from South Eastern Asia (94.5%, a difference of 0.10%), Indonesian (94.5%, a difference of 0.11%), and Bangladeshi (94.5%, a difference of 0.11%).
| Demographics | Rating | Rank | 7th Grade |
| Taiwanese | 0.0 /100 | #289 | Tragic 94.8% |
| Malaysians | 0.0 /100 | #290 | Tragic 94.8% |
| Immigrants | Grenada | 0.0 /100 | #291 | Tragic 94.8% |
| Immigrants | West Indies | 0.0 /100 | #292 | Tragic 94.8% |
| Fijians | 0.0 /100 | #293 | Tragic 94.7% |
| Haitians | 0.0 /100 | #294 | Tragic 94.7% |
| Yaqui | 0.0 /100 | #295 | Tragic 94.6% |
| Cubans | 0.0 /100 | #296 | Tragic 94.6% |
| Immigrants | South Eastern Asia | 0.0 /100 | #297 | Tragic 94.5% |
| Indonesians | 0.0 /100 | #298 | Tragic 94.5% |
| Bangladeshis | 0.0 /100 | #299 | Tragic 94.5% |
| Immigrants | Burma/Myanmar | 0.0 /100 | #300 | Tragic 94.5% |
| Immigrants | Dominica | 0.0 /100 | #301 | Tragic 94.5% |
| Immigrants | Laos | 0.0 /100 | #302 | Tragic 94.5% |
| Sri Lankans | 0.0 /100 | #303 | Tragic 94.4% |
Demographics Similar to Immigrants from Africa by 7th Grade
In terms of 7th grade, the demographic groups most similar to Immigrants from Africa are Nigerian (95.5%, a difference of 0.010%), Asian (95.5%, a difference of 0.010%), Immigrants from Asia (95.5%, a difference of 0.020%), Costa Rican (95.5%, a difference of 0.030%), and Immigrants from Indonesia (95.5%, a difference of 0.030%).
| Demographics | Rating | Rank | 7th Grade |
| Immigrants | Eastern Africa | 5.1 /100 | #228 | Tragic 95.6% |
| Immigrants | Panama | 4.9 /100 | #229 | Tragic 95.6% |
| Natives/Alaskans | 4.2 /100 | #230 | Tragic 95.6% |
| Senegalese | 4.0 /100 | #231 | Tragic 95.6% |
| Costa Ricans | 3.3 /100 | #232 | Tragic 95.5% |
| Immigrants | Indonesia | 3.3 /100 | #233 | Tragic 95.5% |
| Nigerians | 3.0 /100 | #234 | Tragic 95.5% |
| Immigrants | Africa | 2.7 /100 | #235 | Tragic 95.5% |
| Asians | 2.6 /100 | #236 | Tragic 95.5% |
| Immigrants | Asia | 2.3 /100 | #237 | Tragic 95.5% |
| Indians (Asian) | 2.3 /100 | #238 | Tragic 95.5% |
| Jamaicans | 2.2 /100 | #239 | Tragic 95.5% |
| Immigrants | Sierra Leone | 2.0 /100 | #240 | Tragic 95.5% |
| South American Indians | 2.0 /100 | #241 | Tragic 95.5% |
| Immigrants | Senegal | 1.9 /100 | #242 | Tragic 95.5% |