Immigrants from Bangladesh vs Haitian Births to Unmarried Women
COMPARE
Immigrants from Bangladesh
Haitian
Births to Unmarried Women
Births to Unmarried Women Comparison
Immigrants from Bangladesh
Haitians
30.9%
BIRTHS TO UNMARRIED WOMEN
73.9/ 100
METRIC RATING
155th/ 347
METRIC RANK
38.6%
BIRTHS TO UNMARRIED WOMEN
0.0/ 100
METRIC RATING
301st/ 347
METRIC RANK
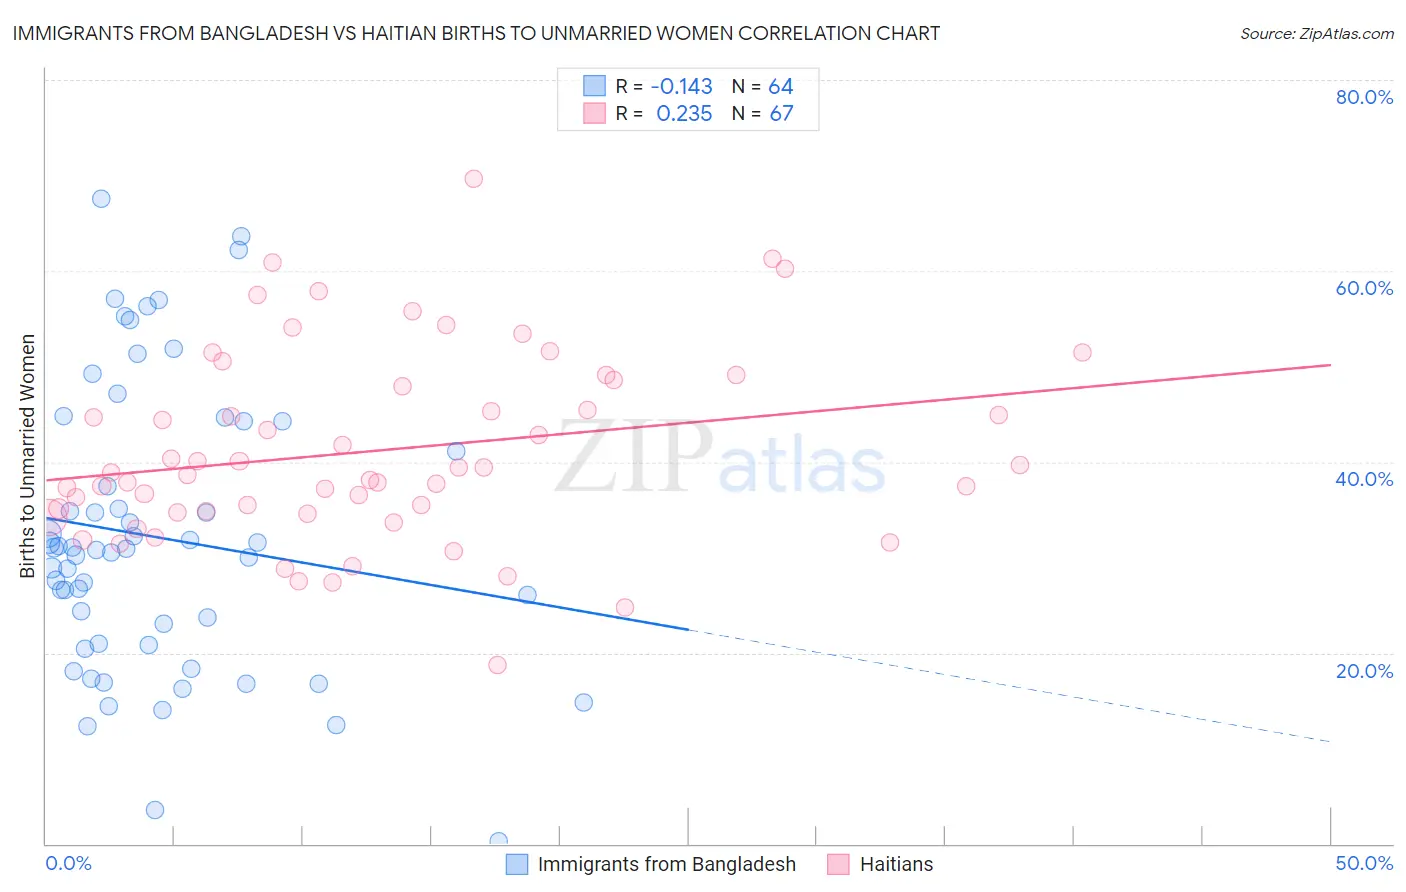
Immigrants from Bangladesh vs Haitian Births to Unmarried Women Correlation Chart
The statistical analysis conducted on geographies consisting of 195,686,757 people shows a poor negative correlation between the proportion of Immigrants from Bangladesh and percentage of births to unmarried women in the United States with a correlation coefficient (R) of -0.143 and weighted average of 30.9%. Similarly, the statistical analysis conducted on geographies consisting of 274,356,790 people shows a weak positive correlation between the proportion of Haitians and percentage of births to unmarried women in the United States with a correlation coefficient (R) of 0.235 and weighted average of 38.6%, a difference of 24.9%.
Births to Unmarried Women Correlation Summary
| Measurement | Immigrants from Bangladesh | Haitian |
| Minimum | 0.20% | 18.8% |
| Maximum | 67.6% | 69.7% |
| Range | 67.4% | 50.9% |
| Mean | 32.1% | 41.2% |
| Median | 30.8% | 38.9% |
| Interquartile 25% (IQ1) | 20.9% | 34.7% |
| Interquartile 75% (IQ3) | 42.6% | 48.5% |
| Interquartile Range (IQR) | 21.8% | 13.8% |
| Standard Deviation (Sample) | 14.9% | 10.0% |
| Standard Deviation (Population) | 14.8% | 9.9% |
Similar Demographics by Births to Unmarried Women
Demographics Similar to Immigrants from Bangladesh by Births to Unmarried Women
In terms of births to unmarried women, the demographic groups most similar to Immigrants from Bangladesh are Carpatho Rusyn (30.9%, a difference of 0.050%), Yugoslavian (30.8%, a difference of 0.15%), Immigrants from Eastern Africa (31.0%, a difference of 0.22%), British (30.8%, a difference of 0.27%), and Polish (30.8%, a difference of 0.29%).
| Demographics | Rating | Rank | Births to Unmarried Women |
| Chileans | 79.1 /100 | #148 | Good 30.7% |
| Serbians | 78.8 /100 | #149 | Good 30.7% |
| Somalis | 77.8 /100 | #150 | Good 30.7% |
| Italians | 77.0 /100 | #151 | Good 30.8% |
| Poles | 76.2 /100 | #152 | Good 30.8% |
| British | 76.0 /100 | #153 | Good 30.8% |
| Yugoslavians | 75.1 /100 | #154 | Good 30.8% |
| Immigrants | Bangladesh | 73.9 /100 | #155 | Good 30.9% |
| Carpatho Rusyns | 73.5 /100 | #156 | Good 30.9% |
| Immigrants | Eastern Africa | 72.1 /100 | #157 | Good 31.0% |
| Austrians | 69.9 /100 | #158 | Good 31.0% |
| Immigrants | England | 69.4 /100 | #159 | Good 31.1% |
| Immigrants | Western Europe | 69.3 /100 | #160 | Good 31.1% |
| Immigrants | Southern Europe | 68.7 /100 | #161 | Good 31.1% |
| Slovenes | 65.9 /100 | #162 | Good 31.2% |
Demographics Similar to Haitians by Births to Unmarried Women
In terms of births to unmarried women, the demographic groups most similar to Haitians are Immigrants from West Indies (38.6%, a difference of 0.010%), Spanish American (38.6%, a difference of 0.070%), Honduran (38.7%, a difference of 0.24%), Jamaican (38.5%, a difference of 0.27%), and Dutch West Indian (38.4%, a difference of 0.47%).
| Demographics | Rating | Rank | Births to Unmarried Women |
| British West Indians | 0.0 /100 | #294 | Tragic 38.0% |
| Iroquois | 0.0 /100 | #295 | Tragic 38.2% |
| Alaska Natives | 0.0 /100 | #296 | Tragic 38.3% |
| Dutch West Indians | 0.0 /100 | #297 | Tragic 38.4% |
| Jamaicans | 0.0 /100 | #298 | Tragic 38.5% |
| Spanish Americans | 0.0 /100 | #299 | Tragic 38.6% |
| Immigrants | West Indies | 0.0 /100 | #300 | Tragic 38.6% |
| Haitians | 0.0 /100 | #301 | Tragic 38.6% |
| Hondurans | 0.0 /100 | #302 | Tragic 38.7% |
| Immigrants | Jamaica | 0.0 /100 | #303 | Tragic 38.8% |
| Yaqui | 0.0 /100 | #304 | Tragic 38.8% |
| Immigrants | Haiti | 0.0 /100 | #305 | Tragic 38.9% |
| Central American Indians | 0.0 /100 | #306 | Tragic 39.0% |
| Immigrants | Honduras | 0.0 /100 | #307 | Tragic 39.3% |
| Aleuts | 0.0 /100 | #308 | Tragic 39.3% |