Crow vs Ute Householder Income Ages 45 - 64 years
COMPARE
Crow
Ute
Householder Income Ages 45 - 64 years
Householder Income Ages 45 - 64 years Comparison
Crow
Ute
$74,257
HOUSEHOLDER INCOME AGES 45 - 64 YEARS
0.0/ 100
METRIC RATING
341st/ 347
METRIC RANK
$83,937
HOUSEHOLDER INCOME AGES 45 - 64 YEARS
0.0/ 100
METRIC RATING
306th/ 347
METRIC RANK
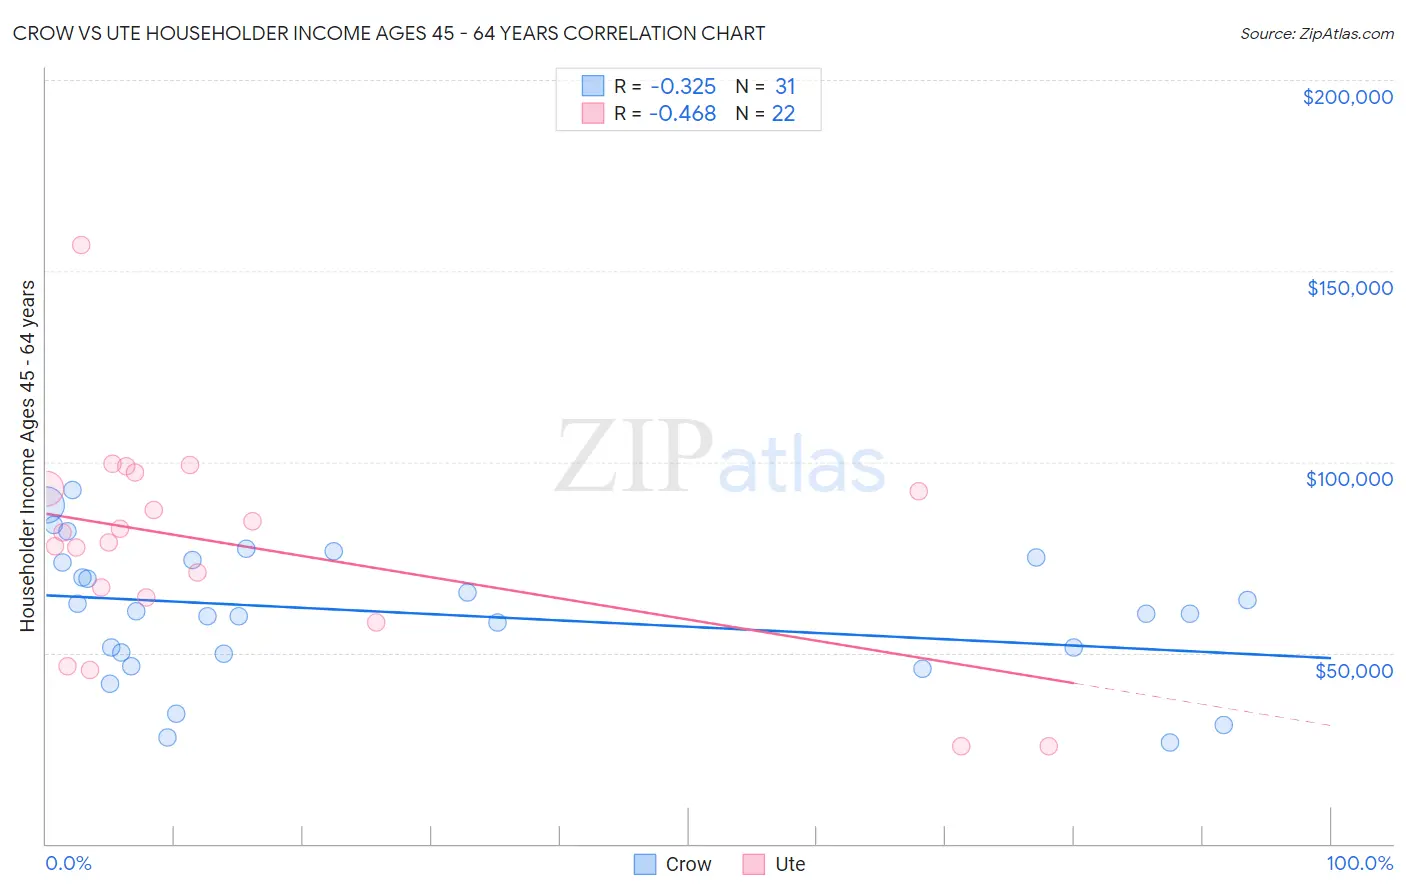
Crow vs Ute Householder Income Ages 45 - 64 years Correlation Chart
The statistical analysis conducted on geographies consisting of 59,167,326 people shows a mild negative correlation between the proportion of Crow and household income with householder between the ages 45 and 64 in the United States with a correlation coefficient (R) of -0.325 and weighted average of $74,257. Similarly, the statistical analysis conducted on geographies consisting of 55,640,692 people shows a moderate negative correlation between the proportion of Ute and household income with householder between the ages 45 and 64 in the United States with a correlation coefficient (R) of -0.468 and weighted average of $83,937, a difference of 13.0%.
Householder Income Ages 45 - 64 years Correlation Summary
| Measurement | Crow | Ute |
| Minimum | $26,667 | $25,694 |
| Maximum | $92,611 | $156,708 |
| Range | $65,944 | $131,014 |
| Mean | $60,312 | $77,764 |
| Median | $60,250 | $80,253 |
| Interquartile 25% (IQ1) | $49,750 | $64,449 |
| Interquartile 75% (IQ3) | $74,167 | $93,045 |
| Interquartile Range (IQR) | $24,417 | $28,595 |
| Standard Deviation (Sample) | $17,381 | $28,260 |
| Standard Deviation (Population) | $17,098 | $27,610 |
Similar Demographics by Householder Income Ages 45 - 64 years
Demographics Similar to Crow by Householder Income Ages 45 - 64 years
In terms of householder income ages 45 - 64 years, the demographic groups most similar to Crow are Immigrants from Yemen ($74,575, a difference of 0.43%), Tohono O'odham ($73,774, a difference of 0.65%), Kiowa ($74,815, a difference of 0.75%), Pima ($73,365, a difference of 1.2%), and Hopi ($75,562, a difference of 1.8%).
| Demographics | Rating | Rank | Householder Income Ages 45 - 64 years |
| Immigrants | Congo | 0.0 /100 | #333 | Tragic $77,850 |
| Menominee | 0.0 /100 | #334 | Tragic $76,903 |
| Cheyenne | 0.0 /100 | #335 | Tragic $76,362 |
| Arapaho | 0.0 /100 | #336 | Tragic $75,945 |
| Pueblo | 0.0 /100 | #337 | Tragic $75,601 |
| Hopi | 0.0 /100 | #338 | Tragic $75,562 |
| Kiowa | 0.0 /100 | #339 | Tragic $74,815 |
| Immigrants | Yemen | 0.0 /100 | #340 | Tragic $74,575 |
| Crow | 0.0 /100 | #341 | Tragic $74,257 |
| Tohono O'odham | 0.0 /100 | #342 | Tragic $73,774 |
| Pima | 0.0 /100 | #343 | Tragic $73,365 |
| Houma | 0.0 /100 | #344 | Tragic $72,093 |
| Navajo | 0.0 /100 | #345 | Tragic $69,759 |
| Puerto Ricans | 0.0 /100 | #346 | Tragic $69,234 |
| Lumbee | 0.0 /100 | #347 | Tragic $65,113 |
Demographics Similar to Ute by Householder Income Ages 45 - 64 years
In terms of householder income ages 45 - 64 years, the demographic groups most similar to Ute are Chippewa ($83,943, a difference of 0.010%), Ottawa ($83,953, a difference of 0.020%), Honduran ($84,079, a difference of 0.17%), Shoshone ($83,588, a difference of 0.42%), and Immigrants from Cabo Verde ($83,542, a difference of 0.47%).
| Demographics | Rating | Rank | Householder Income Ages 45 - 64 years |
| Immigrants | Mexico | 0.0 /100 | #299 | Tragic $84,910 |
| Indonesians | 0.0 /100 | #300 | Tragic $84,890 |
| Potawatomi | 0.0 /100 | #301 | Tragic $84,613 |
| Haitians | 0.0 /100 | #302 | Tragic $84,384 |
| Hondurans | 0.0 /100 | #303 | Tragic $84,079 |
| Ottawa | 0.0 /100 | #304 | Tragic $83,953 |
| Chippewa | 0.0 /100 | #305 | Tragic $83,943 |
| Ute | 0.0 /100 | #306 | Tragic $83,937 |
| Shoshone | 0.0 /100 | #307 | Tragic $83,588 |
| Immigrants | Cabo Verde | 0.0 /100 | #308 | Tragic $83,542 |
| Immigrants | Dominica | 0.0 /100 | #309 | Tragic $83,311 |
| Immigrants | Haiti | 0.0 /100 | #310 | Tragic $83,257 |
| Immigrants | Bahamas | 0.0 /100 | #311 | Tragic $83,177 |
| Cajuns | 0.0 /100 | #312 | Tragic $83,015 |
| U.S. Virgin Islanders | 0.0 /100 | #313 | Tragic $82,736 |