Immigrants from Japan vs Moroccan Births to Unmarried Women
COMPARE
Immigrants from Japan
Moroccan
Births to Unmarried Women
Births to Unmarried Women Comparison
Immigrants from Japan
Moroccans
26.4%
BIRTHS TO UNMARRIED WOMEN
99.9/ 100
METRIC RATING
23rd/ 347
METRIC RANK
31.8%
BIRTHS TO UNMARRIED WOMEN
45.7/ 100
METRIC RATING
180th/ 347
METRIC RANK
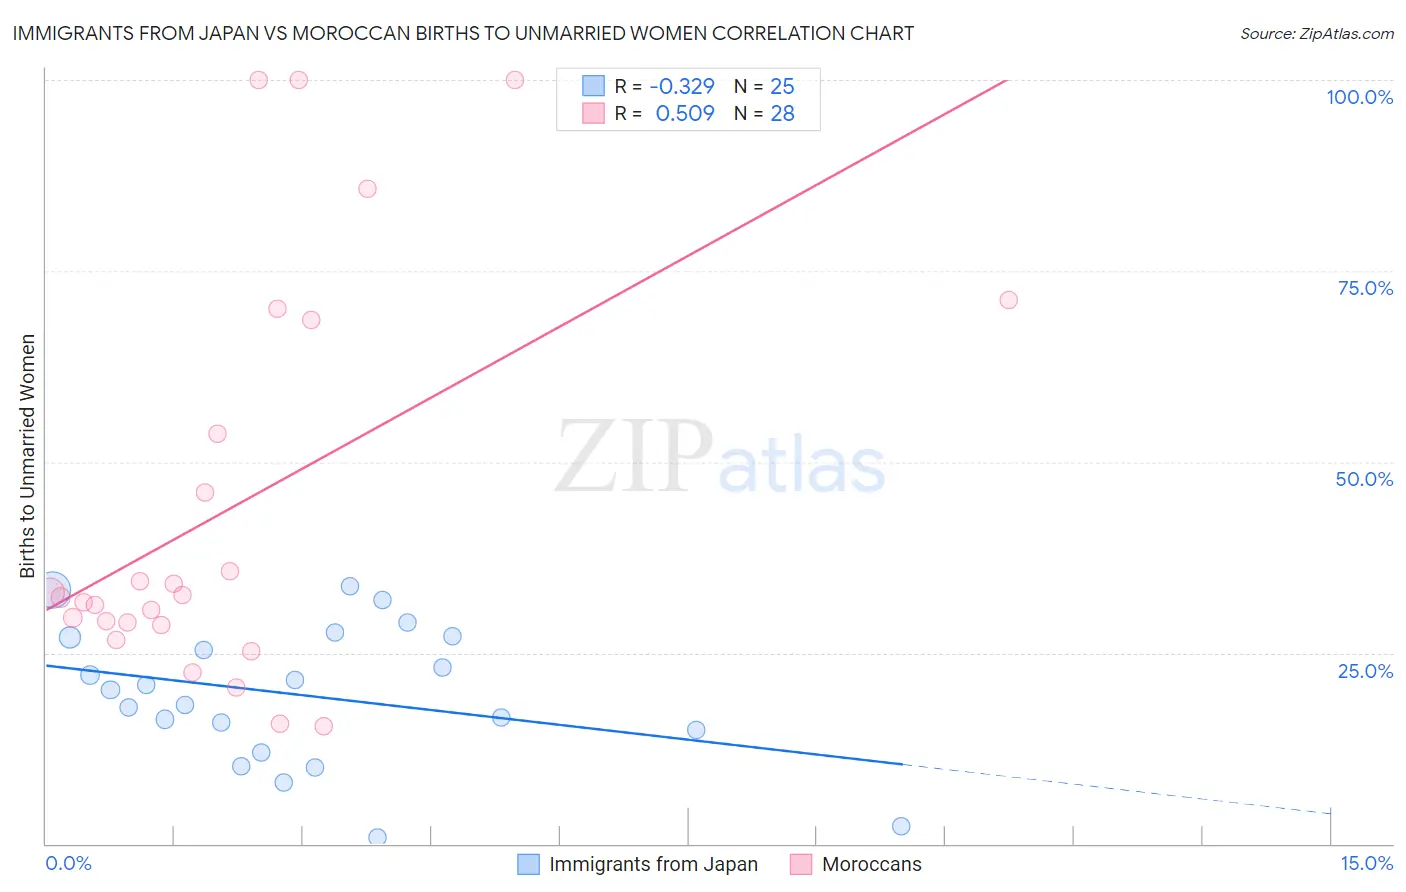
Immigrants from Japan vs Moroccan Births to Unmarried Women Correlation Chart
The statistical analysis conducted on geographies consisting of 319,959,110 people shows a mild negative correlation between the proportion of Immigrants from Japan and percentage of births to unmarried women in the United States with a correlation coefficient (R) of -0.329 and weighted average of 26.4%. Similarly, the statistical analysis conducted on geographies consisting of 194,487,713 people shows a substantial positive correlation between the proportion of Moroccans and percentage of births to unmarried women in the United States with a correlation coefficient (R) of 0.509 and weighted average of 31.8%, a difference of 20.4%.
Births to Unmarried Women Correlation Summary
| Measurement | Immigrants from Japan | Moroccan |
| Minimum | 0.80% | 15.3% |
| Maximum | 33.8% | 100.0% |
| Range | 33.0% | 84.7% |
| Mean | 19.4% | 44.0% |
| Median | 20.2% | 32.4% |
| Interquartile 25% (IQ1) | 13.4% | 28.8% |
| Interquartile 75% (IQ3) | 27.1% | 61.1% |
| Interquartile Range (IQR) | 13.7% | 32.3% |
| Standard Deviation (Sample) | 9.0% | 26.2% |
| Standard Deviation (Population) | 8.8% | 25.8% |
Similar Demographics by Births to Unmarried Women
Demographics Similar to Immigrants from Japan by Births to Unmarried Women
In terms of births to unmarried women, the demographic groups most similar to Immigrants from Japan are Burmese (26.4%, a difference of 0.19%), Soviet Union (26.3%, a difference of 0.41%), Immigrants from Korea (26.3%, a difference of 0.55%), Armenian (26.2%, a difference of 0.76%), and Immigrants from Australia (26.6%, a difference of 0.79%).
| Demographics | Rating | Rank | Births to Unmarried Women |
| Immigrants | Belarus | 100.0 /100 | #16 | Exceptional 25.6% |
| Immigrants | Uzbekistan | 100.0 /100 | #17 | Exceptional 25.8% |
| Immigrants | Armenia | 99.9 /100 | #18 | Exceptional 26.1% |
| Armenians | 99.9 /100 | #19 | Exceptional 26.2% |
| Immigrants | Korea | 99.9 /100 | #20 | Exceptional 26.3% |
| Soviet Union | 99.9 /100 | #21 | Exceptional 26.3% |
| Burmese | 99.9 /100 | #22 | Exceptional 26.4% |
| Immigrants | Japan | 99.9 /100 | #23 | Exceptional 26.4% |
| Immigrants | Australia | 99.9 /100 | #24 | Exceptional 26.6% |
| Cambodians | 99.9 /100 | #25 | Exceptional 26.7% |
| Asians | 99.9 /100 | #26 | Exceptional 26.8% |
| Immigrants | Asia | 99.9 /100 | #27 | Exceptional 26.8% |
| Okinawans | 99.8 /100 | #28 | Exceptional 26.9% |
| Cypriots | 99.8 /100 | #29 | Exceptional 27.0% |
| Bulgarians | 99.8 /100 | #30 | Exceptional 27.1% |
Demographics Similar to Moroccans by Births to Unmarried Women
In terms of births to unmarried women, the demographic groups most similar to Moroccans are Immigrants from Peru (31.8%, a difference of 0.060%), South American (31.8%, a difference of 0.11%), English (31.7%, a difference of 0.15%), South American Indian (31.7%, a difference of 0.18%), and Scottish (31.7%, a difference of 0.22%).
| Demographics | Rating | Rank | Births to Unmarried Women |
| Immigrants | Yemen | 50.2 /100 | #173 | Average 31.7% |
| Venezuelans | 50.0 /100 | #174 | Average 31.7% |
| Immigrants | Venezuela | 49.2 /100 | #175 | Average 31.7% |
| Scottish | 48.1 /100 | #176 | Average 31.7% |
| South American Indians | 47.7 /100 | #177 | Average 31.7% |
| English | 47.4 /100 | #178 | Average 31.7% |
| South Americans | 46.9 /100 | #179 | Average 31.8% |
| Moroccans | 45.7 /100 | #180 | Average 31.8% |
| Immigrants | Peru | 45.1 /100 | #181 | Average 31.8% |
| Kenyans | 43.0 /100 | #182 | Average 31.9% |
| Canadians | 41.4 /100 | #183 | Average 31.9% |
| Immigrants | South America | 40.7 /100 | #184 | Average 32.0% |
| Germans | 39.5 /100 | #185 | Fair 32.0% |
| Welsh | 38.2 /100 | #186 | Fair 32.0% |
| Czechoslovakians | 38.0 /100 | #187 | Fair 32.0% |