Immigrants from Thailand vs Moroccan Births to Unmarried Women
COMPARE
Immigrants from Thailand
Moroccan
Births to Unmarried Women
Births to Unmarried Women Comparison
Immigrants from Thailand
Moroccans
32.8%
BIRTHS TO UNMARRIED WOMEN
18.9/ 100
METRIC RATING
199th/ 347
METRIC RANK
31.8%
BIRTHS TO UNMARRIED WOMEN
45.7/ 100
METRIC RATING
180th/ 347
METRIC RANK
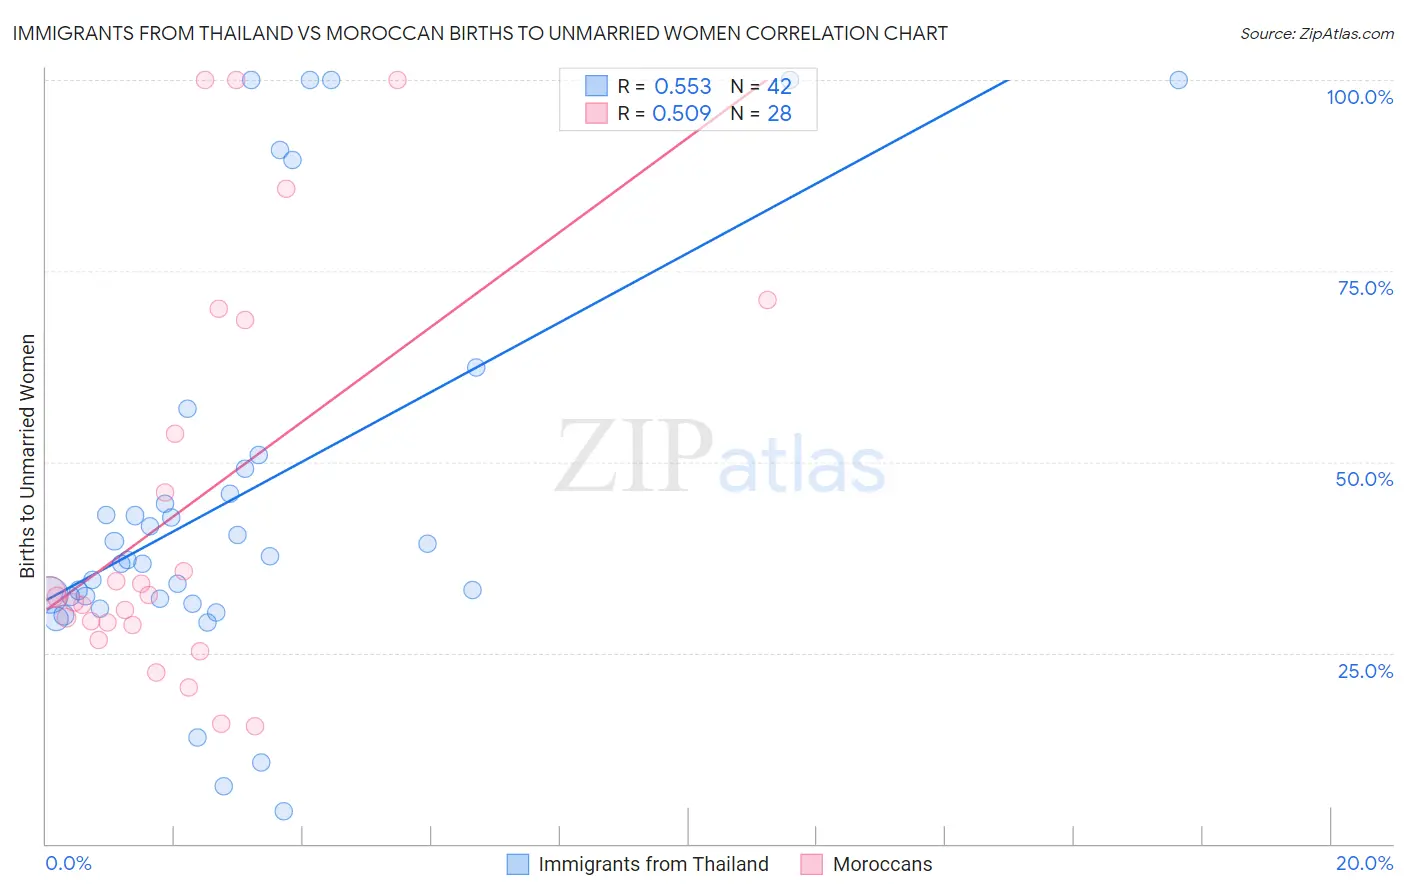
Immigrants from Thailand vs Moroccan Births to Unmarried Women Correlation Chart
The statistical analysis conducted on geographies consisting of 301,314,253 people shows a substantial positive correlation between the proportion of Immigrants from Thailand and percentage of births to unmarried women in the United States with a correlation coefficient (R) of 0.553 and weighted average of 32.8%. Similarly, the statistical analysis conducted on geographies consisting of 194,487,713 people shows a substantial positive correlation between the proportion of Moroccans and percentage of births to unmarried women in the United States with a correlation coefficient (R) of 0.509 and weighted average of 31.8%, a difference of 3.0%.
Births to Unmarried Women Correlation Summary
| Measurement | Immigrants from Thailand | Moroccan |
| Minimum | 4.3% | 15.3% |
| Maximum | 100.0% | 100.0% |
| Range | 95.7% | 84.7% |
| Mean | 45.5% | 44.0% |
| Median | 37.5% | 32.4% |
| Interquartile 25% (IQ1) | 32.2% | 28.8% |
| Interquartile 75% (IQ3) | 49.1% | 61.1% |
| Interquartile Range (IQR) | 17.0% | 32.3% |
| Standard Deviation (Sample) | 26.0% | 26.2% |
| Standard Deviation (Population) | 25.7% | 25.8% |
Demographics Similar to Immigrants from Thailand and Moroccans by Births to Unmarried Women
In terms of births to unmarried women, the demographic groups most similar to Immigrants from Thailand are Costa Rican (32.7%, a difference of 0.20%), Immigrants (32.7%, a difference of 0.25%), Immigrants from Colombia (32.6%, a difference of 0.40%), Samoan (32.6%, a difference of 0.43%), and Sudanese (32.4%, a difference of 1.1%). Similarly, the demographic groups most similar to Moroccans are Immigrants from Peru (31.8%, a difference of 0.060%), South American (31.8%, a difference of 0.11%), Kenyan (31.9%, a difference of 0.26%), Canadian (31.9%, a difference of 0.42%), and Immigrants from South America (32.0%, a difference of 0.49%).
| Demographics | Rating | Rank | Births to Unmarried Women |
| South Americans | 46.9 /100 | #179 | Average 31.8% |
| Moroccans | 45.7 /100 | #180 | Average 31.8% |
| Immigrants | Peru | 45.1 /100 | #181 | Average 31.8% |
| Kenyans | 43.0 /100 | #182 | Average 31.9% |
| Canadians | 41.4 /100 | #183 | Average 31.9% |
| Immigrants | South America | 40.7 /100 | #184 | Average 32.0% |
| Germans | 39.5 /100 | #185 | Fair 32.0% |
| Welsh | 38.2 /100 | #186 | Fair 32.0% |
| Czechoslovakians | 38.0 /100 | #187 | Fair 32.0% |
| Osage | 37.1 /100 | #188 | Fair 32.1% |
| Immigrants | Kenya | 36.9 /100 | #189 | Fair 32.1% |
| Tlingit-Haida | 32.6 /100 | #190 | Fair 32.2% |
| Irish | 32.4 /100 | #191 | Fair 32.2% |
| Colombians | 31.9 /100 | #192 | Fair 32.2% |
| Fijians | 31.1 /100 | #193 | Fair 32.3% |
| Sudanese | 27.3 /100 | #194 | Fair 32.4% |
| Samoans | 21.9 /100 | #195 | Fair 32.6% |
| Immigrants | Colombia | 21.7 /100 | #196 | Fair 32.6% |
| Immigrants | Immigrants | 20.6 /100 | #197 | Fair 32.7% |
| Costa Ricans | 20.3 /100 | #198 | Fair 32.7% |
| Immigrants | Thailand | 18.9 /100 | #199 | Poor 32.8% |