American vs Immigrants from Western Asia Single Mother Households
COMPARE
American
Immigrants from Western Asia
Single Mother Households
Single Mother Households Comparison
Americans
Immigrants from Western Asia
6.6%
SINGLE MOTHER HOUSEHOLDS
19.0/ 100
METRIC RATING
192nd/ 347
METRIC RANK
5.7%
SINGLE MOTHER HOUSEHOLDS
96.7/ 100
METRIC RATING
92nd/ 347
METRIC RANK
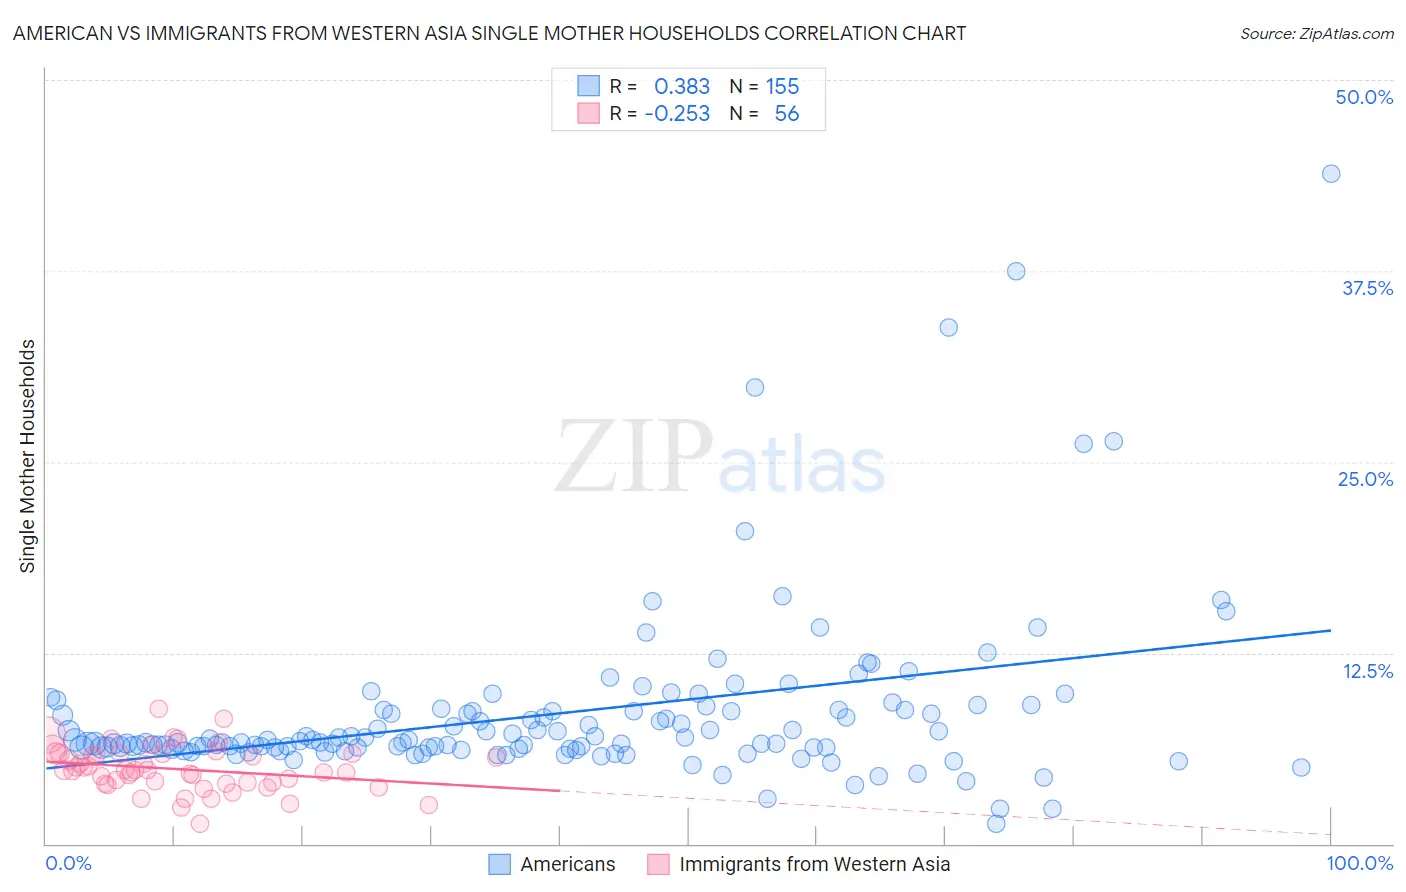
American vs Immigrants from Western Asia Single Mother Households Correlation Chart
The statistical analysis conducted on geographies consisting of 575,485,944 people shows a mild positive correlation between the proportion of Americans and percentage of single mother households in the United States with a correlation coefficient (R) of 0.383 and weighted average of 6.6%. Similarly, the statistical analysis conducted on geographies consisting of 403,187,700 people shows a weak negative correlation between the proportion of Immigrants from Western Asia and percentage of single mother households in the United States with a correlation coefficient (R) of -0.253 and weighted average of 5.7%, a difference of 14.6%.
Single Mother Households Correlation Summary
| Measurement | American | Immigrants from Western Asia |
| Minimum | 1.3% | 1.3% |
| Maximum | 43.9% | 8.8% |
| Range | 42.6% | 7.6% |
| Mean | 8.5% | 4.9% |
| Median | 6.7% | 4.8% |
| Interquartile 25% (IQ1) | 6.3% | 4.0% |
| Interquartile 75% (IQ3) | 8.7% | 5.9% |
| Interquartile Range (IQR) | 2.5% | 1.9% |
| Standard Deviation (Sample) | 5.7% | 1.5% |
| Standard Deviation (Population) | 5.7% | 1.4% |
Similar Demographics by Single Mother Households
Demographics Similar to Americans by Single Mother Households
In terms of single mother households, the demographic groups most similar to Americans are Colombian (6.6%, a difference of 0.11%), Immigrants from Uganda (6.6%, a difference of 0.12%), South American (6.6%, a difference of 0.17%), Uruguayan (6.6%, a difference of 0.17%), and Moroccan (6.6%, a difference of 0.27%).
| Demographics | Rating | Rank | Single Mother Households |
| Ugandans | 25.6 /100 | #185 | Fair 6.5% |
| Costa Ricans | 24.8 /100 | #186 | Fair 6.5% |
| Immigrants | Afghanistan | 24.7 /100 | #187 | Fair 6.5% |
| Ottawa | 23.8 /100 | #188 | Fair 6.5% |
| Delaware | 23.3 /100 | #189 | Fair 6.5% |
| Peruvians | 21.6 /100 | #190 | Fair 6.5% |
| Samoans | 21.2 /100 | #191 | Fair 6.5% |
| Americans | 19.0 /100 | #192 | Poor 6.6% |
| Colombians | 18.3 /100 | #193 | Poor 6.6% |
| Immigrants | Uganda | 18.3 /100 | #194 | Poor 6.6% |
| South Americans | 18.0 /100 | #195 | Poor 6.6% |
| Uruguayans | 18.0 /100 | #196 | Poor 6.6% |
| Moroccans | 17.4 /100 | #197 | Poor 6.6% |
| Hawaiians | 16.1 /100 | #198 | Poor 6.6% |
| Potawatomi | 15.5 /100 | #199 | Poor 6.6% |
Demographics Similar to Immigrants from Western Asia by Single Mother Households
In terms of single mother households, the demographic groups most similar to Immigrants from Western Asia are Serbian (5.7%, a difference of 0.010%), Basque (5.7%, a difference of 0.060%), Slovak (5.7%, a difference of 0.12%), European (5.7%, a difference of 0.23%), and Austrian (5.7%, a difference of 0.27%).
| Demographics | Rating | Rank | Single Mother Households |
| Hungarians | 97.6 /100 | #85 | Exceptional 5.7% |
| Finns | 97.6 /100 | #86 | Exceptional 5.7% |
| Immigrants | Turkey | 97.5 /100 | #87 | Exceptional 5.7% |
| Israelis | 97.4 /100 | #88 | Exceptional 5.7% |
| Ukrainians | 97.2 /100 | #89 | Exceptional 5.7% |
| Immigrants | Indonesia | 97.2 /100 | #90 | Exceptional 5.7% |
| Europeans | 97.0 /100 | #91 | Exceptional 5.7% |
| Immigrants | Western Asia | 96.7 /100 | #92 | Exceptional 5.7% |
| Serbians | 96.7 /100 | #93 | Exceptional 5.7% |
| Basques | 96.7 /100 | #94 | Exceptional 5.7% |
| Slovaks | 96.6 /100 | #95 | Exceptional 5.7% |
| Austrians | 96.4 /100 | #96 | Exceptional 5.7% |
| Tlingit-Haida | 96.4 /100 | #97 | Exceptional 5.7% |
| Immigrants | South Africa | 96.3 /100 | #98 | Exceptional 5.7% |
| Immigrants | Poland | 96.3 /100 | #99 | Exceptional 5.8% |