Crow vs Immigrants from Southern Europe Single Father Households
COMPARE
Crow
Immigrants from Southern Europe
Single Father Households
Single Father Households Comparison
Crow
Immigrants from Southern Europe
3.5%
SINGLE FATHER HOUSEHOLDS
0.0/ 100
METRIC RATING
341st/ 347
METRIC RANK
2.2%
SINGLE FATHER HOUSEHOLDS
98.6/ 100
METRIC RATING
106th/ 347
METRIC RANK
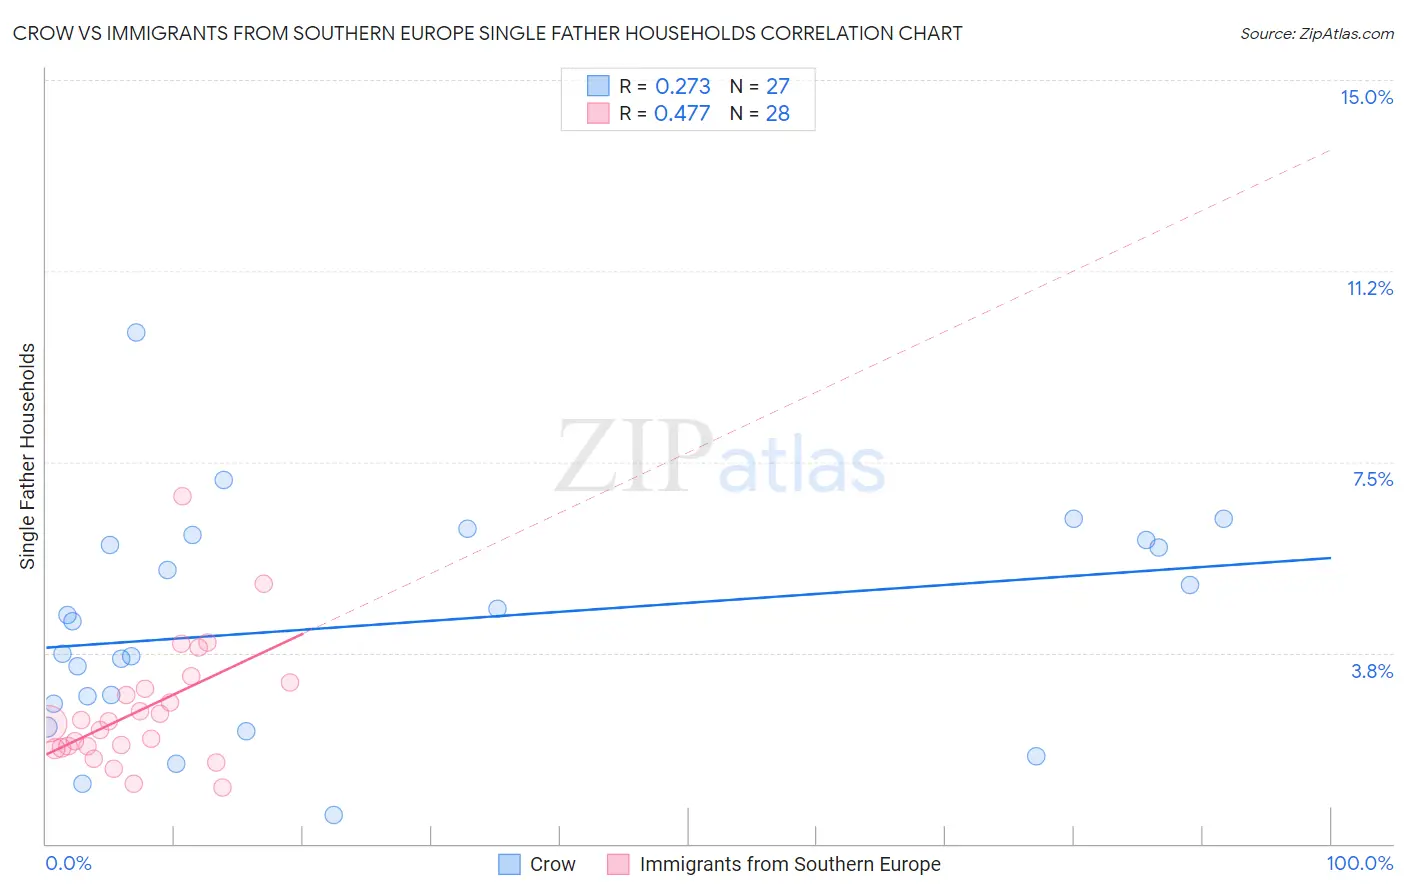
Crow vs Immigrants from Southern Europe Single Father Households Correlation Chart
The statistical analysis conducted on geographies consisting of 59,051,704 people shows a weak positive correlation between the proportion of Crow and percentage of single father households in the United States with a correlation coefficient (R) of 0.273 and weighted average of 3.5%. Similarly, the statistical analysis conducted on geographies consisting of 398,387,388 people shows a moderate positive correlation between the proportion of Immigrants from Southern Europe and percentage of single father households in the United States with a correlation coefficient (R) of 0.477 and weighted average of 2.2%, a difference of 63.0%.
Single Father Households Correlation Summary
| Measurement | Crow | Immigrants from Southern Europe |
| Minimum | 0.55% | 1.1% |
| Maximum | 10.0% | 6.8% |
| Range | 9.5% | 5.7% |
| Mean | 4.3% | 2.6% |
| Median | 4.4% | 2.4% |
| Interquartile 25% (IQ1) | 2.7% | 1.9% |
| Interquartile 75% (IQ3) | 6.0% | 3.1% |
| Interquartile Range (IQR) | 3.2% | 1.2% |
| Standard Deviation (Sample) | 2.1% | 1.2% |
| Standard Deviation (Population) | 2.1% | 1.2% |
Similar Demographics by Single Father Households
Demographics Similar to Crow by Single Father Households
In terms of single father households, the demographic groups most similar to Crow are Alaska Native (3.5%, a difference of 0.35%), Alaskan Athabascan (3.4%, a difference of 4.1%), Sioux (3.3%, a difference of 5.6%), Pueblo (3.3%, a difference of 6.4%), and Paiute (3.3%, a difference of 6.6%).
| Demographics | Rating | Rank | Single Father Households |
| Natives/Alaskans | 0.0 /100 | #333 | Tragic 3.2% |
| Yuman | 0.0 /100 | #334 | Tragic 3.3% |
| Colville | 0.0 /100 | #335 | Tragic 3.3% |
| Paiute | 0.0 /100 | #336 | Tragic 3.3% |
| Pueblo | 0.0 /100 | #337 | Tragic 3.3% |
| Sioux | 0.0 /100 | #338 | Tragic 3.3% |
| Alaskan Athabascans | 0.0 /100 | #339 | Tragic 3.4% |
| Alaska Natives | 0.0 /100 | #340 | Tragic 3.5% |
| Crow | 0.0 /100 | #341 | Tragic 3.5% |
| Tohono O'odham | 0.0 /100 | #342 | Tragic 3.8% |
| Pima | 0.0 /100 | #343 | Tragic 4.2% |
| Yakama | 0.0 /100 | #344 | Tragic 4.2% |
| Menominee | 0.0 /100 | #345 | Tragic 4.2% |
| Inupiat | 0.0 /100 | #346 | Tragic 4.9% |
| Yup'ik | 0.0 /100 | #347 | Tragic 5.4% |
Demographics Similar to Immigrants from Southern Europe by Single Father Households
In terms of single father households, the demographic groups most similar to Immigrants from Southern Europe are Palestinian (2.2%, a difference of 0.11%), Slovene (2.2%, a difference of 0.11%), Immigrants from Netherlands (2.2%, a difference of 0.14%), Barbadian (2.2%, a difference of 0.17%), and Italian (2.2%, a difference of 0.30%).
| Demographics | Rating | Rank | Single Father Households |
| South Africans | 99.1 /100 | #99 | Exceptional 2.1% |
| Immigrants | Northern Africa | 99.0 /100 | #100 | Exceptional 2.1% |
| Immigrants | Western Europe | 98.9 /100 | #101 | Exceptional 2.1% |
| Argentineans | 98.9 /100 | #102 | Exceptional 2.1% |
| Lebanese | 98.9 /100 | #103 | Exceptional 2.1% |
| Alsatians | 98.9 /100 | #104 | Exceptional 2.1% |
| Palestinians | 98.6 /100 | #105 | Exceptional 2.2% |
| Immigrants | Southern Europe | 98.6 /100 | #106 | Exceptional 2.2% |
| Slovenes | 98.5 /100 | #107 | Exceptional 2.2% |
| Immigrants | Netherlands | 98.5 /100 | #108 | Exceptional 2.2% |
| Barbadians | 98.4 /100 | #109 | Exceptional 2.2% |
| Italians | 98.3 /100 | #110 | Exceptional 2.2% |
| Immigrants | Canada | 98.3 /100 | #111 | Exceptional 2.2% |
| Immigrants | Trinidad and Tobago | 98.2 /100 | #112 | Exceptional 2.2% |
| Iraqis | 98.2 /100 | #113 | Exceptional 2.2% |