Crow vs Chilean Unemployment Among Seniors over 75 years
COMPARE
Crow
Chilean
Unemployment Among Seniors over 75 years
Unemployment Among Seniors over 75 years Comparison
Crow
Chileans
5.9%
UNEMPLOYMENT AMONG SENIORS OVER 75 YEARS
100.0/ 100
METRIC RATING
1st/ 347
METRIC RANK
8.4%
UNEMPLOYMENT AMONG SENIORS OVER 75 YEARS
93.8/ 100
METRIC RATING
132nd/ 347
METRIC RANK
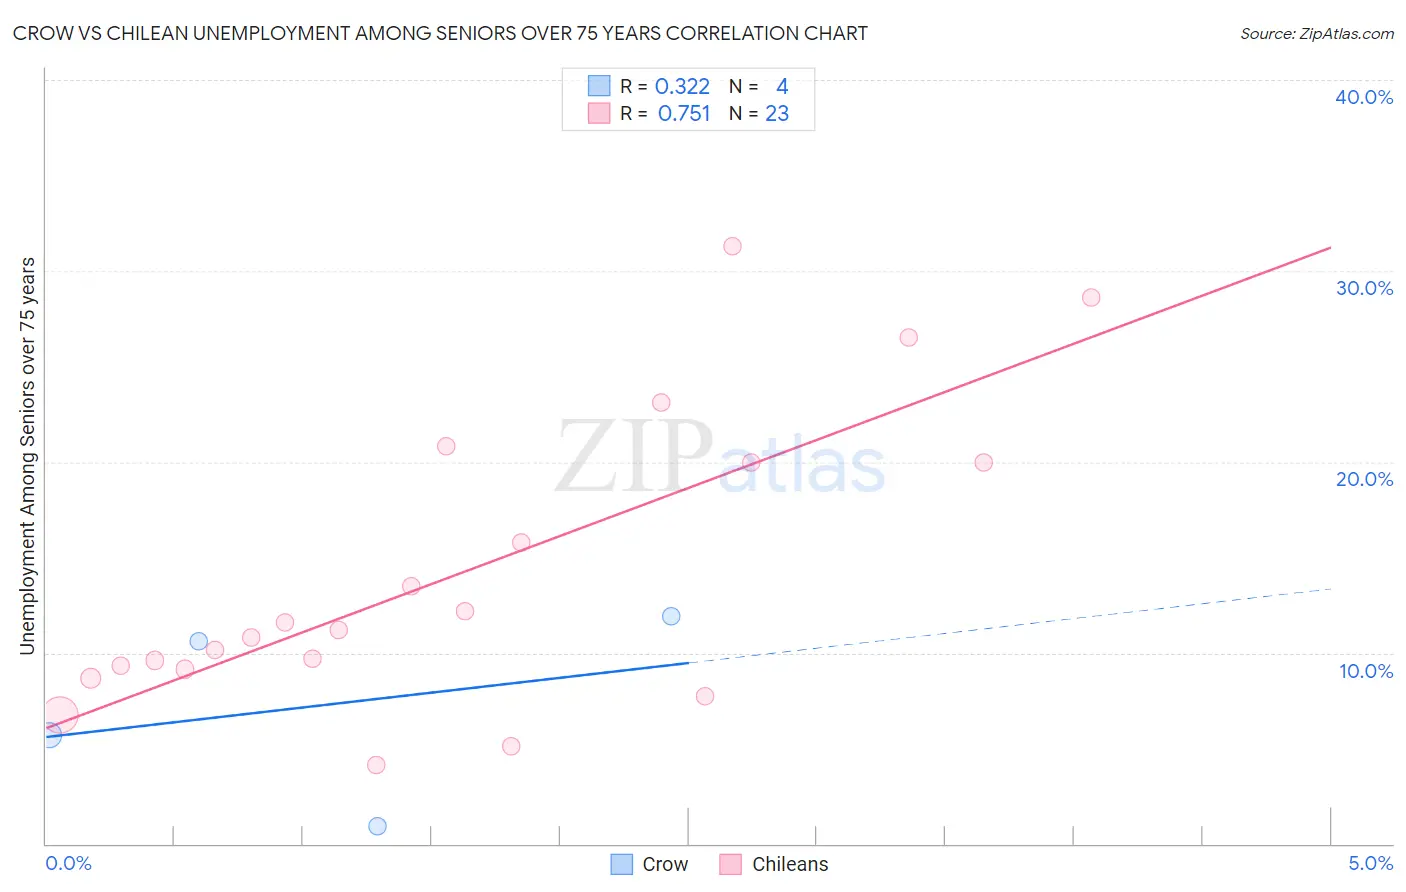
Crow vs Chilean Unemployment Among Seniors over 75 years Correlation Chart
The statistical analysis conducted on geographies consisting of 45,464,482 people shows a mild positive correlation between the proportion of Crow and unemployment rate among seniors over the age of 75 in the United States with a correlation coefficient (R) of 0.322 and weighted average of 5.9%. Similarly, the statistical analysis conducted on geographies consisting of 155,927,496 people shows a strong positive correlation between the proportion of Chileans and unemployment rate among seniors over the age of 75 in the United States with a correlation coefficient (R) of 0.751 and weighted average of 8.4%, a difference of 42.6%.
Unemployment Among Seniors over 75 years Correlation Summary
| Measurement | Crow | Chilean |
| Minimum | 0.90% | 4.1% |
| Maximum | 11.9% | 31.3% |
| Range | 11.0% | 27.2% |
| Mean | 7.3% | 14.2% |
| Median | 8.1% | 11.2% |
| Interquartile 25% (IQ1) | 3.3% | 9.1% |
| Interquartile 75% (IQ3) | 11.3% | 20.0% |
| Interquartile Range (IQR) | 8.0% | 10.9% |
| Standard Deviation (Sample) | 5.0% | 7.7% |
| Standard Deviation (Population) | 4.4% | 7.5% |
Similar Demographics by Unemployment Among Seniors over 75 years
Demographics Similar to Crow by Unemployment Among Seniors over 75 years
In terms of unemployment among seniors over 75 years, the demographic groups most similar to Crow are Chinese (5.9%, a difference of 0.010%), Cheyenne (5.9%, a difference of 0.56%), Alsatian (6.1%, a difference of 3.5%), Hopi (6.3%, a difference of 6.1%), and Immigrants from Armenia (6.5%, a difference of 10.2%).
| Demographics | Rating | Rank | Unemployment Among Seniors over 75 years |
| Crow | 100.0 /100 | #1 | Exceptional 5.9% |
| Chinese | 100.0 /100 | #2 | Exceptional 5.9% |
| Cheyenne | 100.0 /100 | #3 | Exceptional 5.9% |
| Alsatians | 100.0 /100 | #4 | Exceptional 6.1% |
| Hopi | 100.0 /100 | #5 | Exceptional 6.3% |
| Immigrants | Armenia | 100.0 /100 | #6 | Exceptional 6.5% |
| Spanish American Indians | 100.0 /100 | #7 | Exceptional 6.5% |
| Taiwanese | 100.0 /100 | #8 | Exceptional 6.6% |
| Soviet Union | 100.0 /100 | #9 | Exceptional 6.6% |
| Yuman | 100.0 /100 | #10 | Exceptional 6.7% |
| Immigrants | Grenada | 100.0 /100 | #11 | Exceptional 6.7% |
| Comanche | 100.0 /100 | #12 | Exceptional 6.7% |
| Immigrants | Congo | 100.0 /100 | #13 | Exceptional 6.7% |
| Ute | 100.0 /100 | #14 | Exceptional 6.8% |
| Icelanders | 100.0 /100 | #15 | Exceptional 7.0% |
Demographics Similar to Chileans by Unemployment Among Seniors over 75 years
In terms of unemployment among seniors over 75 years, the demographic groups most similar to Chileans are Serbian (8.4%, a difference of 0.030%), Immigrants from Czechoslovakia (8.4%, a difference of 0.11%), German Russian (8.4%, a difference of 0.28%), Apache (8.4%, a difference of 0.37%), and Haitian (8.5%, a difference of 0.50%).
| Demographics | Rating | Rank | Unemployment Among Seniors over 75 years |
| Immigrants | Moldova | 96.7 /100 | #125 | Exceptional 8.3% |
| Belizeans | 96.3 /100 | #126 | Exceptional 8.4% |
| Hondurans | 96.2 /100 | #127 | Exceptional 8.4% |
| Native Hawaiians | 96.1 /100 | #128 | Exceptional 8.4% |
| Ghanaians | 96.0 /100 | #129 | Exceptional 8.4% |
| Apache | 95.2 /100 | #130 | Exceptional 8.4% |
| German Russians | 94.9 /100 | #131 | Exceptional 8.4% |
| Chileans | 93.8 /100 | #132 | Exceptional 8.4% |
| Serbians | 93.7 /100 | #133 | Exceptional 8.4% |
| Immigrants | Czechoslovakia | 93.4 /100 | #134 | Exceptional 8.4% |
| Haitians | 91.4 /100 | #135 | Exceptional 8.5% |
| Immigrants | Trinidad and Tobago | 90.8 /100 | #136 | Exceptional 8.5% |
| Immigrants | Kuwait | 90.5 /100 | #137 | Exceptional 8.5% |
| Immigrants | Bulgaria | 89.6 /100 | #138 | Excellent 8.5% |
| Barbadians | 88.6 /100 | #139 | Excellent 8.5% |