Immigrants from Lebanon vs Immigrants from Cabo Verde Currently Married
COMPARE
Immigrants from Lebanon
Immigrants from Cabo Verde
Currently Married
Currently Married Comparison
Immigrants from Lebanon
Immigrants from Cabo Verde
48.2%
CURRENTLY MARRIED
97.6/ 100
METRIC RATING
72nd/ 347
METRIC RANK
37.8%
CURRENTLY MARRIED
0.0/ 100
METRIC RATING
344th/ 347
METRIC RANK
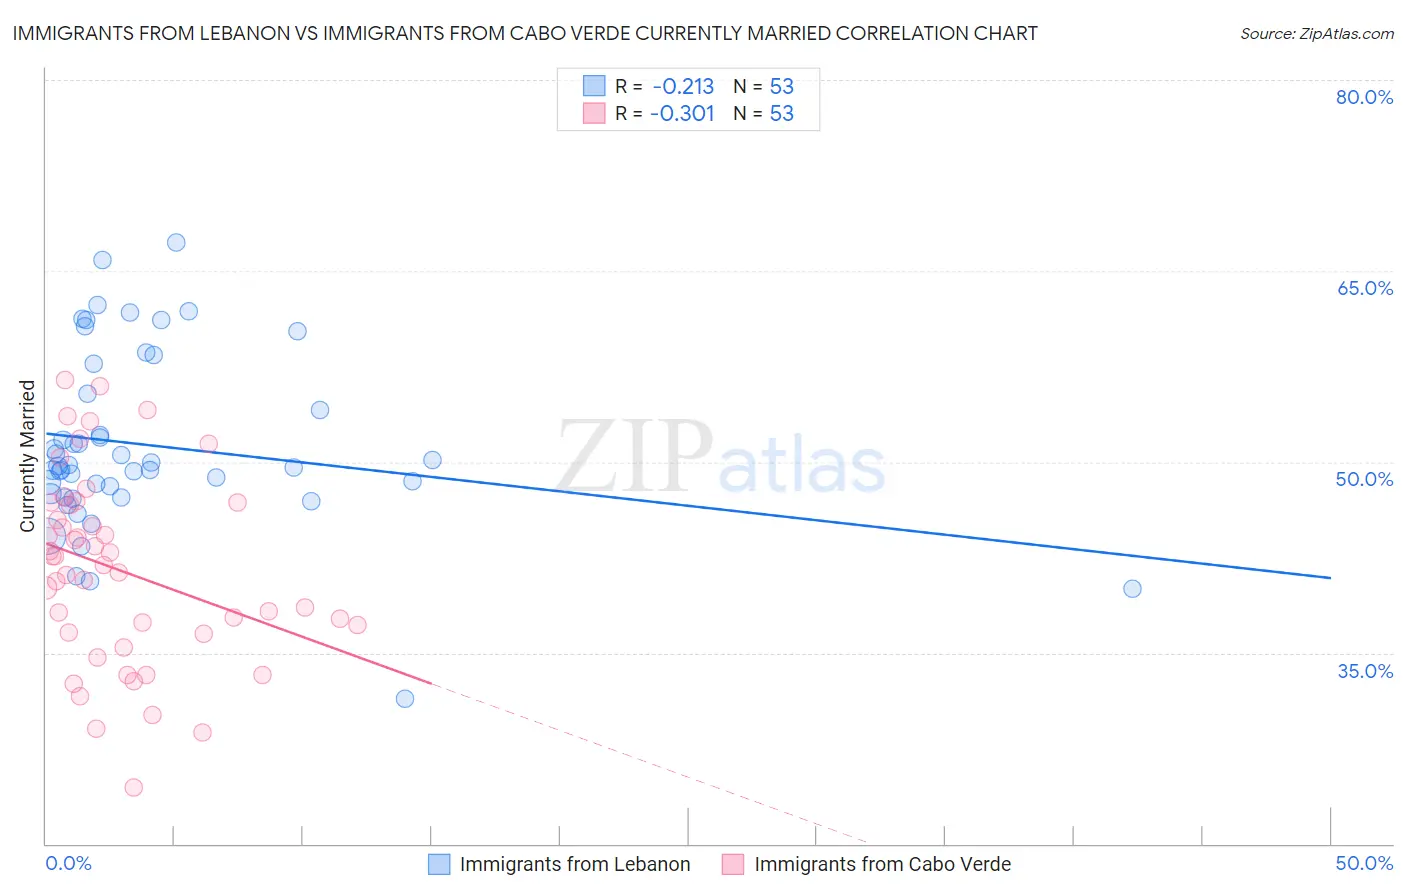
Immigrants from Lebanon vs Immigrants from Cabo Verde Currently Married Correlation Chart
The statistical analysis conducted on geographies consisting of 217,155,711 people shows a weak negative correlation between the proportion of Immigrants from Lebanon and percentage of population currently married in the United States with a correlation coefficient (R) of -0.213 and weighted average of 48.2%. Similarly, the statistical analysis conducted on geographies consisting of 38,158,666 people shows a mild negative correlation between the proportion of Immigrants from Cabo Verde and percentage of population currently married in the United States with a correlation coefficient (R) of -0.301 and weighted average of 37.8%, a difference of 27.4%.
Currently Married Correlation Summary
| Measurement | Immigrants from Lebanon | Immigrants from Cabo Verde |
| Minimum | 31.4% | 24.4% |
| Maximum | 67.2% | 56.5% |
| Range | 35.8% | 32.1% |
| Mean | 51.3% | 41.5% |
| Median | 49.7% | 41.9% |
| Interquartile 25% (IQ1) | 47.4% | 36.6% |
| Interquartile 75% (IQ3) | 56.5% | 46.7% |
| Interquartile Range (IQR) | 9.2% | 10.1% |
| Standard Deviation (Sample) | 7.0% | 7.4% |
| Standard Deviation (Population) | 6.9% | 7.3% |
Similar Demographics by Currently Married
Demographics Similar to Immigrants from Lebanon by Currently Married
In terms of currently married, the demographic groups most similar to Immigrants from Lebanon are Immigrants from Eastern Asia (48.2%, a difference of 0.020%), Estonian (48.2%, a difference of 0.050%), Immigrants from Belarus (48.1%, a difference of 0.12%), Macedonian (48.3%, a difference of 0.14%), and Basque (48.1%, a difference of 0.14%).
| Demographics | Rating | Rank | Currently Married |
| Ukrainians | 98.3 /100 | #65 | Exceptional 48.4% |
| Tongans | 98.2 /100 | #66 | Exceptional 48.3% |
| Slovaks | 98.2 /100 | #67 | Exceptional 48.3% |
| Immigrants | England | 98.2 /100 | #68 | Exceptional 48.3% |
| Canadians | 98.1 /100 | #69 | Exceptional 48.3% |
| Immigrants | Asia | 97.9 /100 | #70 | Exceptional 48.3% |
| Macedonians | 97.9 /100 | #71 | Exceptional 48.3% |
| Immigrants | Lebanon | 97.6 /100 | #72 | Exceptional 48.2% |
| Immigrants | Eastern Asia | 97.5 /100 | #73 | Exceptional 48.2% |
| Estonians | 97.4 /100 | #74 | Exceptional 48.2% |
| Immigrants | Belarus | 97.2 /100 | #75 | Exceptional 48.1% |
| Basques | 97.2 /100 | #76 | Exceptional 48.1% |
| Slovenes | 97.1 /100 | #77 | Exceptional 48.1% |
| Immigrants | Belgium | 97.1 /100 | #78 | Exceptional 48.1% |
| Immigrants | South Africa | 97.0 /100 | #79 | Exceptional 48.1% |
Demographics Similar to Immigrants from Cabo Verde by Currently Married
In terms of currently married, the demographic groups most similar to Immigrants from Cabo Verde are Pueblo (38.2%, a difference of 1.1%), Tohono O'odham (36.8%, a difference of 2.9%), Immigrants from Dominican Republic (38.9%, a difference of 2.9%), Navajo (39.0%, a difference of 3.1%), and Immigrants from Grenada (39.1%, a difference of 3.5%).
| Demographics | Rating | Rank | Currently Married |
| Yup'ik | 0.0 /100 | #333 | Tragic 39.9% |
| Puerto Ricans | 0.0 /100 | #334 | Tragic 39.9% |
| Lumbee | 0.0 /100 | #335 | Tragic 39.8% |
| British West Indians | 0.0 /100 | #336 | Tragic 39.8% |
| Blacks/African Americans | 0.0 /100 | #337 | Tragic 39.6% |
| Cape Verdeans | 0.0 /100 | #338 | Tragic 39.6% |
| Dominicans | 0.0 /100 | #339 | Tragic 39.5% |
| Immigrants | Grenada | 0.0 /100 | #340 | Tragic 39.1% |
| Navajo | 0.0 /100 | #341 | Tragic 39.0% |
| Immigrants | Dominican Republic | 0.0 /100 | #342 | Tragic 38.9% |
| Pueblo | 0.0 /100 | #343 | Tragic 38.2% |
| Immigrants | Cabo Verde | 0.0 /100 | #344 | Tragic 37.8% |
| Tohono O'odham | 0.0 /100 | #345 | Tragic 36.8% |
| Hopi | 0.0 /100 | #346 | Tragic 36.5% |
| Pima | 0.0 /100 | #347 | Tragic 35.9% |