Cree vs Bulgarian Currently Married
COMPARE
Cree
Bulgarian
Currently Married
Currently Married Comparison
Cree
Bulgarians
44.9%
CURRENTLY MARRIED
1.7/ 100
METRIC RATING
229th/ 347
METRIC RANK
49.1%
CURRENTLY MARRIED
99.7/ 100
METRIC RATING
22nd/ 347
METRIC RANK
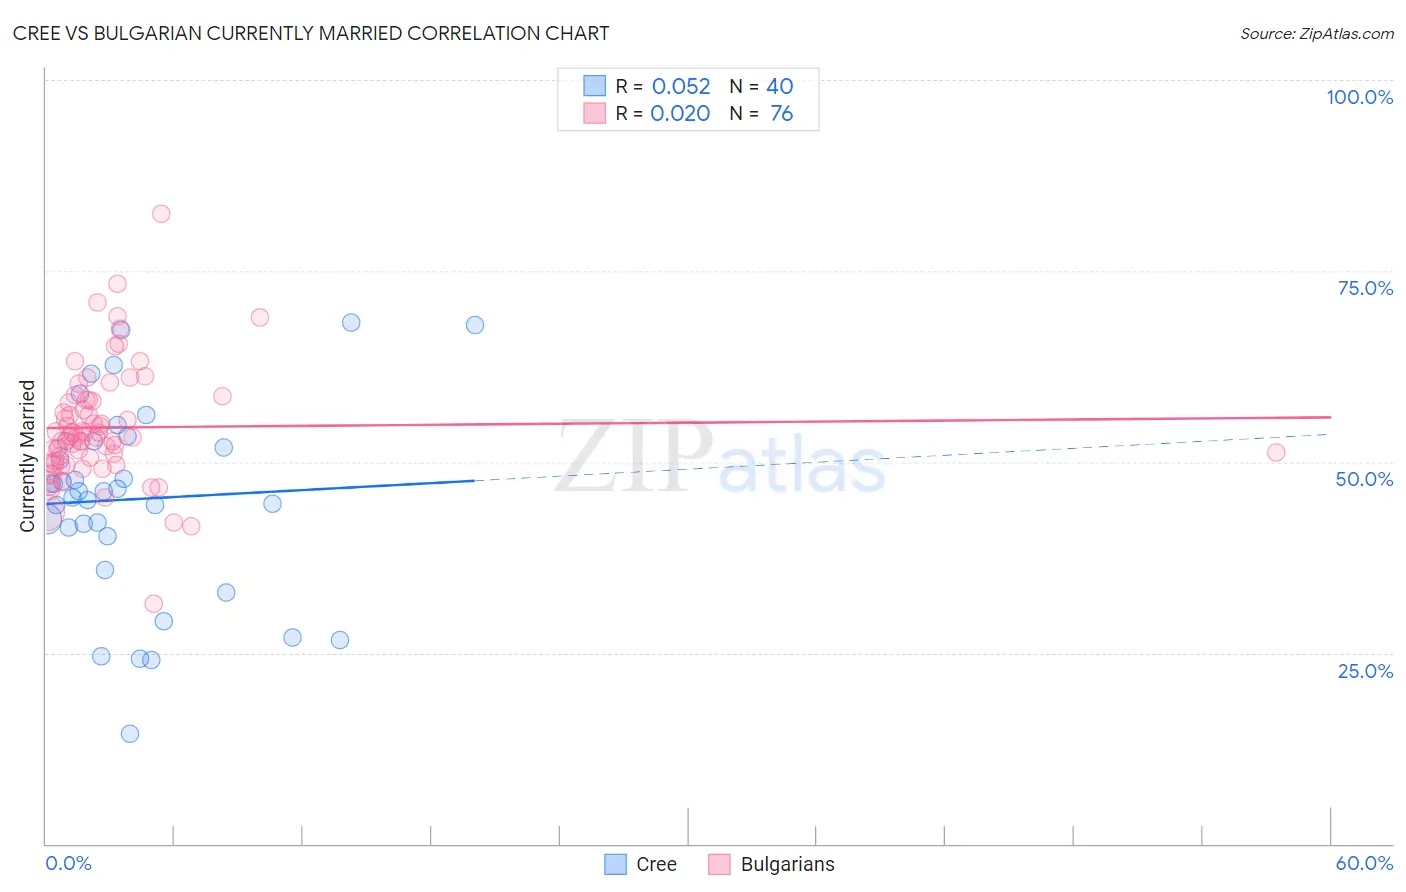
Cree vs Bulgarian Currently Married Correlation Chart
The statistical analysis conducted on geographies consisting of 76,211,685 people shows a slight positive correlation between the proportion of Cree and percentage of population currently married in the United States with a correlation coefficient (R) of 0.052 and weighted average of 44.9%. Similarly, the statistical analysis conducted on geographies consisting of 205,615,003 people shows no correlation between the proportion of Bulgarians and percentage of population currently married in the United States with a correlation coefficient (R) of 0.020 and weighted average of 49.1%, a difference of 9.4%.
Currently Married Correlation Summary
| Measurement | Cree | Bulgarian |
| Minimum | 14.4% | 31.5% |
| Maximum | 68.3% | 82.5% |
| Range | 53.9% | 51.0% |
| Mean | 45.1% | 54.5% |
| Median | 46.1% | 53.3% |
| Interquartile 25% (IQ1) | 40.8% | 49.9% |
| Interquartile 75% (IQ3) | 52.6% | 58.0% |
| Interquartile Range (IQR) | 11.8% | 8.1% |
| Standard Deviation (Sample) | 12.7% | 7.7% |
| Standard Deviation (Population) | 12.5% | 7.6% |
Similar Demographics by Currently Married
Demographics Similar to Cree by Currently Married
In terms of currently married, the demographic groups most similar to Cree are Immigrants from Kenya (44.9%, a difference of 0.040%), Immigrants from Panama (44.9%, a difference of 0.080%), Spanish American (45.0%, a difference of 0.19%), Immigrants from Uruguay (45.0%, a difference of 0.19%), and Comanche (45.0%, a difference of 0.20%).
| Demographics | Rating | Rank | Currently Married |
| Immigrants | Azores | 2.5 /100 | #222 | Tragic 45.1% |
| Immigrants | Laos | 2.3 /100 | #223 | Tragic 45.0% |
| Immigrants | Uganda | 2.2 /100 | #224 | Tragic 45.0% |
| French American Indians | 2.2 /100 | #225 | Tragic 45.0% |
| Comanche | 2.1 /100 | #226 | Tragic 45.0% |
| Spanish Americans | 2.1 /100 | #227 | Tragic 45.0% |
| Immigrants | Uruguay | 2.0 /100 | #228 | Tragic 45.0% |
| Cree | 1.7 /100 | #229 | Tragic 44.9% |
| Immigrants | Kenya | 1.6 /100 | #230 | Tragic 44.9% |
| Immigrants | Panama | 1.5 /100 | #231 | Tragic 44.9% |
| Nepalese | 1.2 /100 | #232 | Tragic 44.7% |
| Immigrants | Saudi Arabia | 1.1 /100 | #233 | Tragic 44.7% |
| Iroquois | 1.1 /100 | #234 | Tragic 44.7% |
| Alaskan Athabascans | 0.9 /100 | #235 | Tragic 44.6% |
| Cubans | 0.9 /100 | #236 | Tragic 44.6% |
Demographics Similar to Bulgarians by Currently Married
In terms of currently married, the demographic groups most similar to Bulgarians are Immigrants from Pakistan (49.1%, a difference of 0.11%), Scottish (49.2%, a difference of 0.22%), Lithuanian (49.0%, a difference of 0.22%), Maltese (49.0%, a difference of 0.23%), and Immigrants from Korea (49.0%, a difference of 0.28%).
| Demographics | Rating | Rank | Currently Married |
| Pennsylvania Germans | 99.9 /100 | #15 | Exceptional 49.6% |
| Chinese | 99.9 /100 | #16 | Exceptional 49.5% |
| Scandinavians | 99.9 /100 | #17 | Exceptional 49.5% |
| Immigrants | Scotland | 99.8 /100 | #18 | Exceptional 49.3% |
| Europeans | 99.8 /100 | #19 | Exceptional 49.3% |
| Luxembourgers | 99.8 /100 | #20 | Exceptional 49.3% |
| Scottish | 99.8 /100 | #21 | Exceptional 49.2% |
| Bulgarians | 99.7 /100 | #22 | Exceptional 49.1% |
| Immigrants | Pakistan | 99.7 /100 | #23 | Exceptional 49.1% |
| Lithuanians | 99.6 /100 | #24 | Exceptional 49.0% |
| Maltese | 99.6 /100 | #25 | Exceptional 49.0% |
| Immigrants | Korea | 99.6 /100 | #26 | Exceptional 49.0% |
| Burmese | 99.6 /100 | #27 | Exceptional 48.9% |
| Welsh | 99.5 /100 | #28 | Exceptional 48.9% |
| Croatians | 99.5 /100 | #29 | Exceptional 48.9% |