Costa Rican vs Samoan Births to Unmarried Women
COMPARE
Costa Rican
Samoan
Births to Unmarried Women
Births to Unmarried Women Comparison
Costa Ricans
Samoans
32.7%
BIRTHS TO UNMARRIED WOMEN
20.3/ 100
METRIC RATING
198th/ 347
METRIC RANK
32.6%
BIRTHS TO UNMARRIED WOMEN
21.9/ 100
METRIC RATING
195th/ 347
METRIC RANK
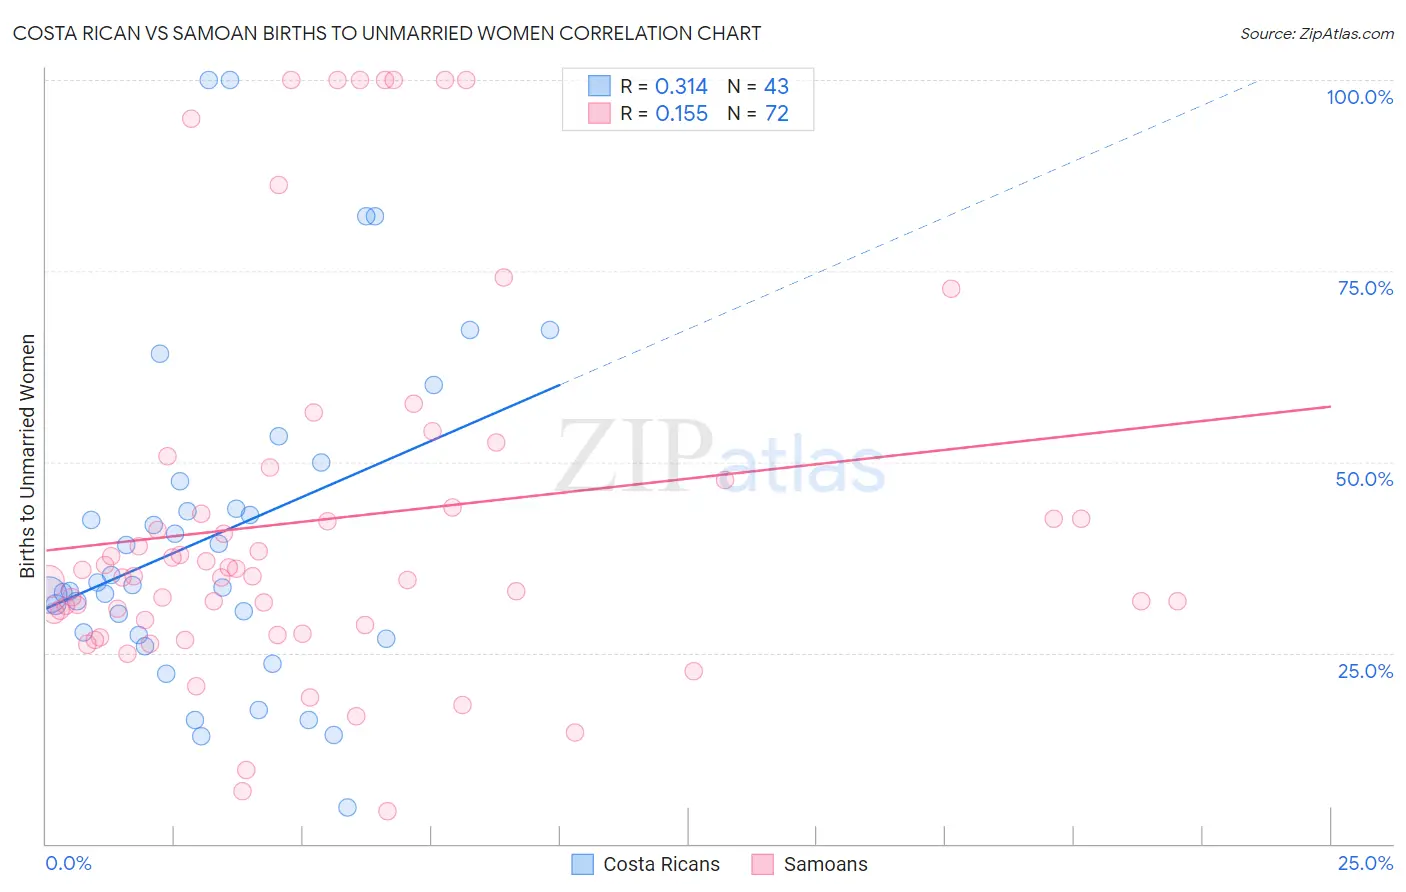
Costa Rican vs Samoan Births to Unmarried Women Correlation Chart
The statistical analysis conducted on geographies consisting of 243,618,809 people shows a mild positive correlation between the proportion of Costa Ricans and percentage of births to unmarried women in the United States with a correlation coefficient (R) of 0.314 and weighted average of 32.7%. Similarly, the statistical analysis conducted on geographies consisting of 217,867,082 people shows a poor positive correlation between the proportion of Samoans and percentage of births to unmarried women in the United States with a correlation coefficient (R) of 0.155 and weighted average of 32.6%, a difference of 0.23%.
Births to Unmarried Women Correlation Summary
| Measurement | Costa Rican | Samoan |
| Minimum | 4.8% | 4.3% |
| Maximum | 100.0% | 100.0% |
| Range | 95.2% | 95.7% |
| Mean | 40.4% | 42.4% |
| Median | 33.9% | 35.0% |
| Interquartile 25% (IQ1) | 27.3% | 28.9% |
| Interquartile 75% (IQ3) | 47.4% | 45.8% |
| Interquartile Range (IQR) | 20.1% | 16.9% |
| Standard Deviation (Sample) | 21.7% | 24.4% |
| Standard Deviation (Population) | 21.4% | 24.2% |
Demographics Similar to Costa Ricans and Samoans by Births to Unmarried Women
In terms of births to unmarried women, the demographic groups most similar to Costa Ricans are Immigrants (32.7%, a difference of 0.050%), Immigrants from Colombia (32.6%, a difference of 0.20%), Immigrants from Thailand (32.8%, a difference of 0.20%), Immigrants from Germany (32.8%, a difference of 0.22%), and Immigrants from Burma/Myanmar (32.9%, a difference of 0.55%). Similarly, the demographic groups most similar to Samoans are Immigrants from Colombia (32.6%, a difference of 0.030%), Immigrants (32.7%, a difference of 0.18%), Immigrants from Thailand (32.8%, a difference of 0.43%), Immigrants from Germany (32.8%, a difference of 0.44%), and Sudanese (32.4%, a difference of 0.67%).
| Demographics | Rating | Rank | Births to Unmarried Women |
| Welsh | 38.2 /100 | #186 | Fair 32.0% |
| Czechoslovakians | 38.0 /100 | #187 | Fair 32.0% |
| Osage | 37.1 /100 | #188 | Fair 32.1% |
| Immigrants | Kenya | 36.9 /100 | #189 | Fair 32.1% |
| Tlingit-Haida | 32.6 /100 | #190 | Fair 32.2% |
| Irish | 32.4 /100 | #191 | Fair 32.2% |
| Colombians | 31.9 /100 | #192 | Fair 32.2% |
| Fijians | 31.1 /100 | #193 | Fair 32.3% |
| Sudanese | 27.3 /100 | #194 | Fair 32.4% |
| Samoans | 21.9 /100 | #195 | Fair 32.6% |
| Immigrants | Colombia | 21.7 /100 | #196 | Fair 32.6% |
| Immigrants | Immigrants | 20.6 /100 | #197 | Fair 32.7% |
| Costa Ricans | 20.3 /100 | #198 | Fair 32.7% |
| Immigrants | Thailand | 18.9 /100 | #199 | Poor 32.8% |
| Immigrants | Germany | 18.8 /100 | #200 | Poor 32.8% |
| Immigrants | Burma/Myanmar | 16.7 /100 | #201 | Poor 32.9% |
| Immigrants | Micronesia | 16.6 /100 | #202 | Poor 32.9% |
| Ute | 14.4 /100 | #203 | Poor 33.0% |
| Immigrants | Africa | 14.3 /100 | #204 | Poor 33.0% |
| German Russians | 13.1 /100 | #205 | Poor 33.1% |
| Uruguayans | 12.8 /100 | #206 | Poor 33.1% |