Immigrants from Peru vs Samoan Births to Unmarried Women
COMPARE
Immigrants from Peru
Samoan
Births to Unmarried Women
Births to Unmarried Women Comparison
Immigrants from Peru
Samoans
31.8%
BIRTHS TO UNMARRIED WOMEN
45.1/ 100
METRIC RATING
181st/ 347
METRIC RANK
32.6%
BIRTHS TO UNMARRIED WOMEN
21.9/ 100
METRIC RATING
195th/ 347
METRIC RANK
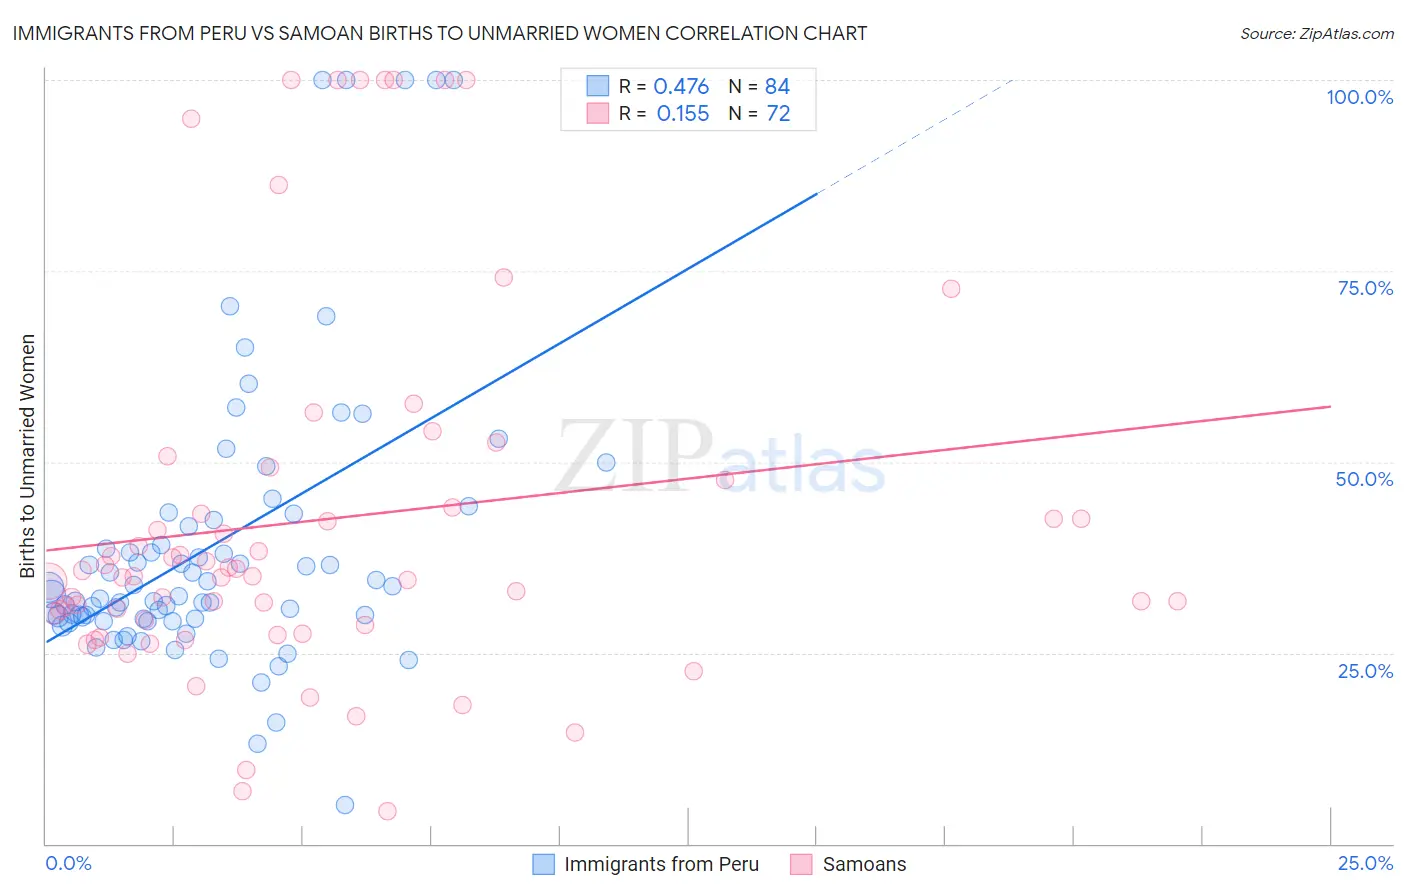
Immigrants from Peru vs Samoan Births to Unmarried Women Correlation Chart
The statistical analysis conducted on geographies consisting of 311,348,081 people shows a moderate positive correlation between the proportion of Immigrants from Peru and percentage of births to unmarried women in the United States with a correlation coefficient (R) of 0.476 and weighted average of 31.8%. Similarly, the statistical analysis conducted on geographies consisting of 217,867,082 people shows a poor positive correlation between the proportion of Samoans and percentage of births to unmarried women in the United States with a correlation coefficient (R) of 0.155 and weighted average of 32.6%, a difference of 2.5%.
Births to Unmarried Women Correlation Summary
| Measurement | Immigrants from Peru | Samoan |
| Minimum | 5.1% | 4.3% |
| Maximum | 100.0% | 100.0% |
| Range | 94.9% | 95.7% |
| Mean | 39.0% | 42.4% |
| Median | 32.5% | 35.0% |
| Interquartile 25% (IQ1) | 29.5% | 28.9% |
| Interquartile 75% (IQ3) | 41.9% | 45.8% |
| Interquartile Range (IQR) | 12.4% | 16.9% |
| Standard Deviation (Sample) | 19.1% | 24.4% |
| Standard Deviation (Population) | 18.9% | 24.2% |
Demographics Similar to Immigrants from Peru and Samoans by Births to Unmarried Women
In terms of births to unmarried women, the demographic groups most similar to Immigrants from Peru are Moroccan (31.8%, a difference of 0.060%), South American (31.8%, a difference of 0.18%), Kenyan (31.9%, a difference of 0.20%), English (31.7%, a difference of 0.22%), and Canadian (31.9%, a difference of 0.35%). Similarly, the demographic groups most similar to Samoans are Immigrants from Colombia (32.6%, a difference of 0.030%), Immigrants (32.7%, a difference of 0.18%), Costa Rican (32.7%, a difference of 0.23%), Sudanese (32.4%, a difference of 0.67%), and Fijian (32.3%, a difference of 1.1%).
| Demographics | Rating | Rank | Births to Unmarried Women |
| English | 47.4 /100 | #178 | Average 31.7% |
| South Americans | 46.9 /100 | #179 | Average 31.8% |
| Moroccans | 45.7 /100 | #180 | Average 31.8% |
| Immigrants | Peru | 45.1 /100 | #181 | Average 31.8% |
| Kenyans | 43.0 /100 | #182 | Average 31.9% |
| Canadians | 41.4 /100 | #183 | Average 31.9% |
| Immigrants | South America | 40.7 /100 | #184 | Average 32.0% |
| Germans | 39.5 /100 | #185 | Fair 32.0% |
| Welsh | 38.2 /100 | #186 | Fair 32.0% |
| Czechoslovakians | 38.0 /100 | #187 | Fair 32.0% |
| Osage | 37.1 /100 | #188 | Fair 32.1% |
| Immigrants | Kenya | 36.9 /100 | #189 | Fair 32.1% |
| Tlingit-Haida | 32.6 /100 | #190 | Fair 32.2% |
| Irish | 32.4 /100 | #191 | Fair 32.2% |
| Colombians | 31.9 /100 | #192 | Fair 32.2% |
| Fijians | 31.1 /100 | #193 | Fair 32.3% |
| Sudanese | 27.3 /100 | #194 | Fair 32.4% |
| Samoans | 21.9 /100 | #195 | Fair 32.6% |
| Immigrants | Colombia | 21.7 /100 | #196 | Fair 32.6% |
| Immigrants | Immigrants | 20.6 /100 | #197 | Fair 32.7% |
| Costa Ricans | 20.3 /100 | #198 | Fair 32.7% |