Costa Rican vs Samoan Male Unemployment
COMPARE
Costa Rican
Samoan
Male Unemployment
Male Unemployment Comparison
Costa Ricans
Samoans
5.4%
MALE UNEMPLOYMENT
31.3/ 100
METRIC RATING
187th/ 347
METRIC RANK
5.5%
MALE UNEMPLOYMENT
4.9/ 100
METRIC RATING
215th/ 347
METRIC RANK
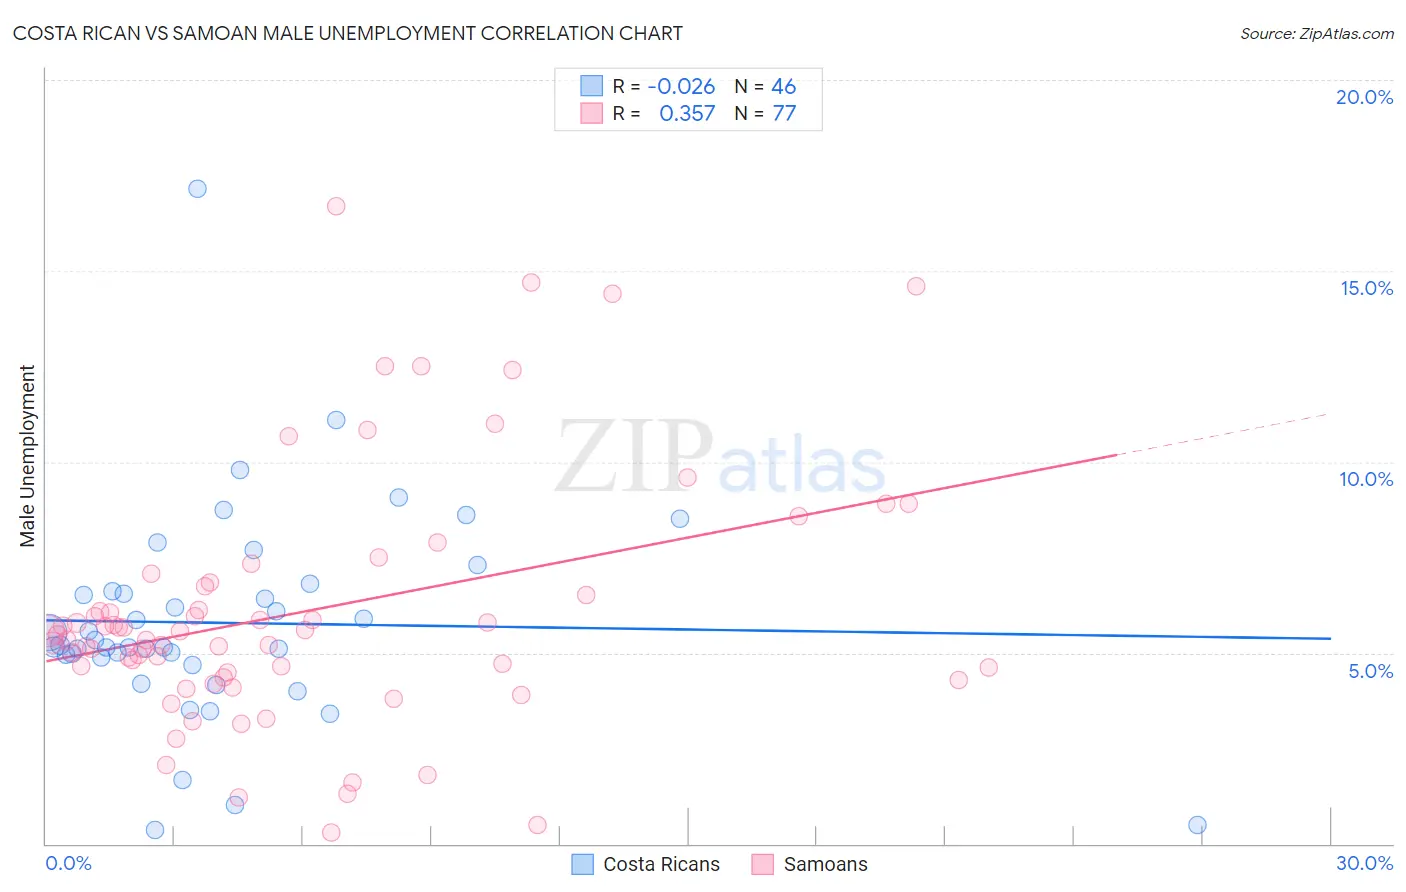
Costa Rican vs Samoan Male Unemployment Correlation Chart
The statistical analysis conducted on geographies consisting of 253,200,475 people shows no correlation between the proportion of Costa Ricans and unemployment rate among males in the United States with a correlation coefficient (R) of -0.026 and weighted average of 5.4%. Similarly, the statistical analysis conducted on geographies consisting of 224,577,965 people shows a mild positive correlation between the proportion of Samoans and unemployment rate among males in the United States with a correlation coefficient (R) of 0.357 and weighted average of 5.5%, a difference of 3.2%.
Male Unemployment Correlation Summary
| Measurement | Costa Rican | Samoan |
| Minimum | 0.35% | 0.30% |
| Maximum | 17.2% | 16.7% |
| Range | 16.8% | 16.4% |
| Mean | 5.8% | 6.1% |
| Median | 5.2% | 5.5% |
| Interquartile 25% (IQ1) | 4.9% | 4.4% |
| Interquartile 75% (IQ3) | 6.6% | 6.8% |
| Interquartile Range (IQR) | 1.8% | 2.4% |
| Standard Deviation (Sample) | 2.8% | 3.3% |
| Standard Deviation (Population) | 2.8% | 3.3% |
Similar Demographics by Male Unemployment
Demographics Similar to Costa Ricans by Male Unemployment
In terms of male unemployment, the demographic groups most similar to Costa Ricans are Iraqi (5.4%, a difference of 0.010%), Arab (5.4%, a difference of 0.080%), Immigrants from South America (5.4%, a difference of 0.13%), Immigrants from Uganda (5.4%, a difference of 0.18%), and Immigrants from South Eastern Asia (5.4%, a difference of 0.21%).
| Demographics | Rating | Rank | Male Unemployment |
| Malaysians | 39.6 /100 | #180 | Fair 5.3% |
| Immigrants | Afghanistan | 37.9 /100 | #181 | Fair 5.3% |
| Potawatomi | 37.8 /100 | #182 | Fair 5.3% |
| Taiwanese | 37.6 /100 | #183 | Fair 5.3% |
| Spaniards | 35.1 /100 | #184 | Fair 5.3% |
| Koreans | 34.9 /100 | #185 | Fair 5.3% |
| Iraqis | 31.6 /100 | #186 | Fair 5.4% |
| Costa Ricans | 31.3 /100 | #187 | Fair 5.4% |
| Arabs | 30.2 /100 | #188 | Fair 5.4% |
| Immigrants | South America | 29.4 /100 | #189 | Fair 5.4% |
| Immigrants | Uganda | 28.8 /100 | #190 | Fair 5.4% |
| Immigrants | South Eastern Asia | 28.2 /100 | #191 | Fair 5.4% |
| Immigrants | Belarus | 26.0 /100 | #192 | Fair 5.4% |
| Immigrants | Israel | 25.2 /100 | #193 | Fair 5.4% |
| Spanish | 19.7 /100 | #194 | Poor 5.4% |
Demographics Similar to Samoans by Male Unemployment
In terms of male unemployment, the demographic groups most similar to Samoans are Immigrants (5.5%, a difference of 0.17%), Puget Sound Salish (5.5%, a difference of 0.20%), Delaware (5.5%, a difference of 0.22%), Ugandan (5.5%, a difference of 0.37%), and Immigrants from Albania (5.5%, a difference of 0.43%).
| Demographics | Rating | Rank | Male Unemployment |
| Immigrants | Lebanon | 8.6 /100 | #208 | Tragic 5.5% |
| Immigrants | Middle Africa | 8.3 /100 | #209 | Tragic 5.5% |
| South American Indians | 7.6 /100 | #210 | Tragic 5.5% |
| Israelis | 7.4 /100 | #211 | Tragic 5.5% |
| Hmong | 7.0 /100 | #212 | Tragic 5.5% |
| Ugandans | 6.3 /100 | #213 | Tragic 5.5% |
| Puget Sound Salish | 5.6 /100 | #214 | Tragic 5.5% |
| Samoans | 4.9 /100 | #215 | Tragic 5.5% |
| Immigrants | Immigrants | 4.3 /100 | #216 | Tragic 5.5% |
| Delaware | 4.2 /100 | #217 | Tragic 5.5% |
| Immigrants | Albania | 3.6 /100 | #218 | Tragic 5.5% |
| Immigrants | Western Asia | 3.5 /100 | #219 | Tragic 5.6% |
| Portuguese | 3.5 /100 | #220 | Tragic 5.6% |
| Soviet Union | 3.2 /100 | #221 | Tragic 5.6% |
| Immigrants | Micronesia | 2.9 /100 | #222 | Tragic 5.6% |