Slovene vs Iroquois Births to Unmarried Women
COMPARE
Slovene
Iroquois
Births to Unmarried Women
Births to Unmarried Women Comparison
Slovenes
Iroquois
31.2%
BIRTHS TO UNMARRIED WOMEN
65.9/ 100
METRIC RATING
162nd/ 347
METRIC RANK
38.2%
BIRTHS TO UNMARRIED WOMEN
0.0/ 100
METRIC RATING
295th/ 347
METRIC RANK
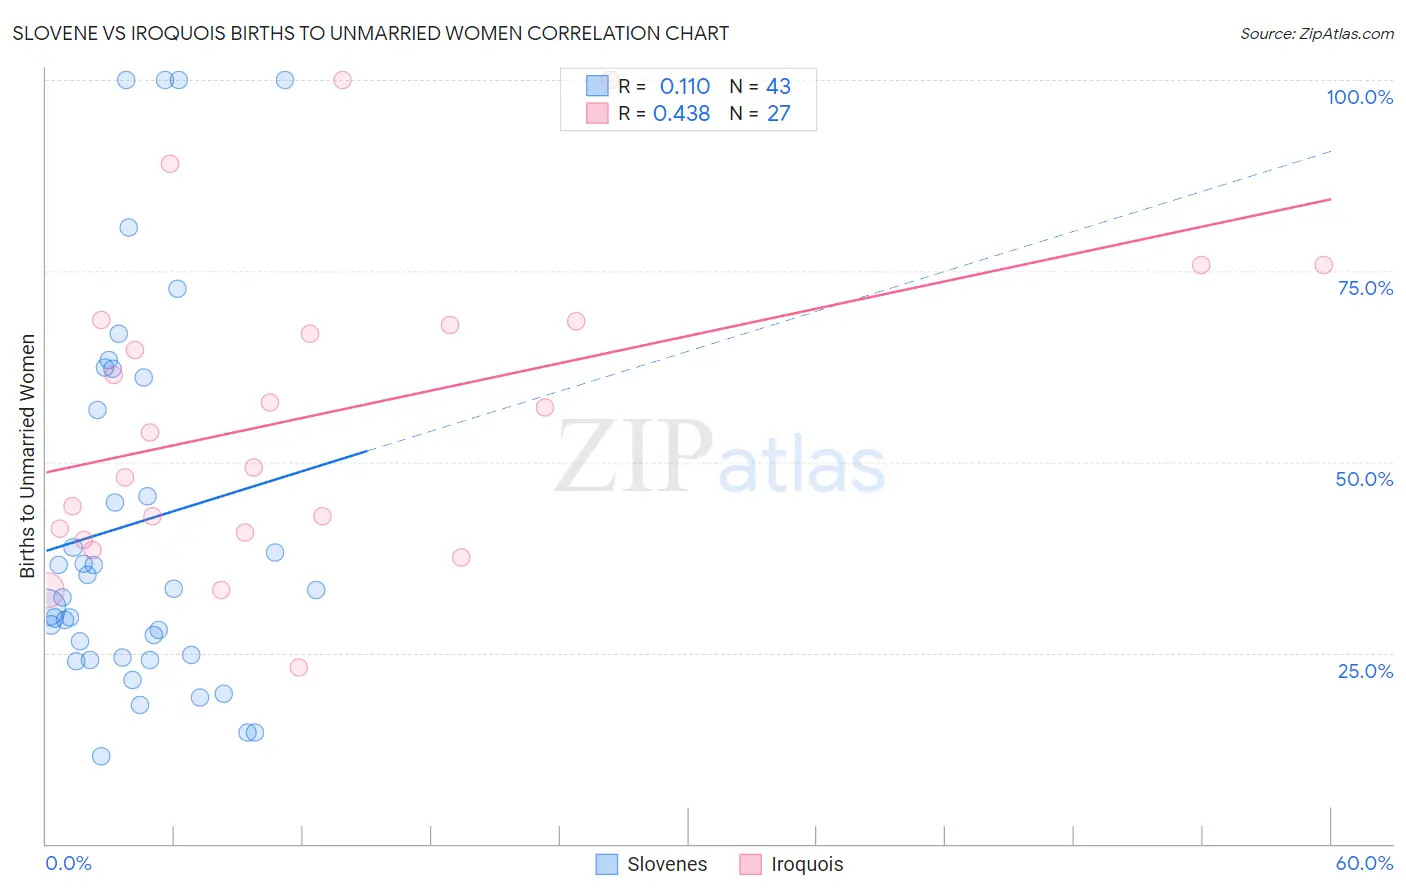
Slovene vs Iroquois Births to Unmarried Women Correlation Chart
The statistical analysis conducted on geographies consisting of 244,653,742 people shows a poor positive correlation between the proportion of Slovenes and percentage of births to unmarried women in the United States with a correlation coefficient (R) of 0.110 and weighted average of 31.2%. Similarly, the statistical analysis conducted on geographies consisting of 199,233,897 people shows a moderate positive correlation between the proportion of Iroquois and percentage of births to unmarried women in the United States with a correlation coefficient (R) of 0.438 and weighted average of 38.2%, a difference of 22.5%.
Births to Unmarried Women Correlation Summary
| Measurement | Slovene | Iroquois |
| Minimum | 11.4% | 23.1% |
| Maximum | 100.0% | 100.0% |
| Range | 88.6% | 76.9% |
| Mean | 42.0% | 56.3% |
| Median | 33.3% | 53.8% |
| Interquartile 25% (IQ1) | 24.4% | 40.8% |
| Interquartile 75% (IQ3) | 61.0% | 68.4% |
| Interquartile Range (IQR) | 36.7% | 27.6% |
| Standard Deviation (Sample) | 25.0% | 20.1% |
| Standard Deviation (Population) | 24.7% | 19.7% |
Similar Demographics by Births to Unmarried Women
Demographics Similar to Slovenes by Births to Unmarried Women
In terms of births to unmarried women, the demographic groups most similar to Slovenes are Immigrants from Chile (31.2%, a difference of 0.020%), Hungarian (31.2%, a difference of 0.19%), Immigrants from Southern Europe (31.1%, a difference of 0.31%), Immigrants from England (31.1%, a difference of 0.38%), and Immigrants from Western Europe (31.1%, a difference of 0.38%).
| Demographics | Rating | Rank | Births to Unmarried Women |
| Immigrants | Bangladesh | 73.9 /100 | #155 | Good 30.9% |
| Carpatho Rusyns | 73.5 /100 | #156 | Good 30.9% |
| Immigrants | Eastern Africa | 72.1 /100 | #157 | Good 31.0% |
| Austrians | 69.9 /100 | #158 | Good 31.0% |
| Immigrants | England | 69.4 /100 | #159 | Good 31.1% |
| Immigrants | Western Europe | 69.3 /100 | #160 | Good 31.1% |
| Immigrants | Southern Europe | 68.7 /100 | #161 | Good 31.1% |
| Slovenes | 65.9 /100 | #162 | Good 31.2% |
| Immigrants | Chile | 65.7 /100 | #163 | Good 31.2% |
| Hungarians | 64.1 /100 | #164 | Good 31.2% |
| Immigrants | Somalia | 58.1 /100 | #165 | Average 31.4% |
| Peruvians | 55.5 /100 | #166 | Average 31.5% |
| Dutch | 55.3 /100 | #167 | Average 31.5% |
| Belgians | 52.4 /100 | #168 | Average 31.6% |
| Slavs | 52.0 /100 | #169 | Average 31.6% |
Demographics Similar to Iroquois by Births to Unmarried Women
In terms of births to unmarried women, the demographic groups most similar to Iroquois are Alaska Native (38.3%, a difference of 0.24%), Dutch West Indian (38.4%, a difference of 0.52%), British West Indian (38.0%, a difference of 0.55%), Immigrants from Nicaragua (38.0%, a difference of 0.60%), and Jamaican (38.5%, a difference of 0.72%).
| Demographics | Rating | Rank | Births to Unmarried Women |
| Immigrants | Liberia | 0.0 /100 | #288 | Tragic 37.6% |
| Alaskan Athabascans | 0.0 /100 | #289 | Tragic 37.7% |
| Hispanics or Latinos | 0.0 /100 | #290 | Tragic 37.8% |
| Seminole | 0.0 /100 | #291 | Tragic 37.9% |
| Blackfeet | 0.0 /100 | #292 | Tragic 37.9% |
| Immigrants | Nicaragua | 0.0 /100 | #293 | Tragic 38.0% |
| British West Indians | 0.0 /100 | #294 | Tragic 38.0% |
| Iroquois | 0.0 /100 | #295 | Tragic 38.2% |
| Alaska Natives | 0.0 /100 | #296 | Tragic 38.3% |
| Dutch West Indians | 0.0 /100 | #297 | Tragic 38.4% |
| Jamaicans | 0.0 /100 | #298 | Tragic 38.5% |
| Spanish Americans | 0.0 /100 | #299 | Tragic 38.6% |
| Immigrants | West Indies | 0.0 /100 | #300 | Tragic 38.6% |
| Haitians | 0.0 /100 | #301 | Tragic 38.6% |
| Hondurans | 0.0 /100 | #302 | Tragic 38.7% |