Immigrants from St. Vincent and the Grenadines vs Immigrants from Guyana Currently Married
COMPARE
Immigrants from St. Vincent and the Grenadines
Immigrants from Guyana
Currently Married
Currently Married Comparison
Immigrants from St. Vincent and the Grenadines
Immigrants from Guyana
40.1%
CURRENTLY MARRIED
0.0/ 100
METRIC RATING
332nd/ 347
METRIC RANK
41.9%
CURRENTLY MARRIED
0.0/ 100
METRIC RATING
306th/ 347
METRIC RANK
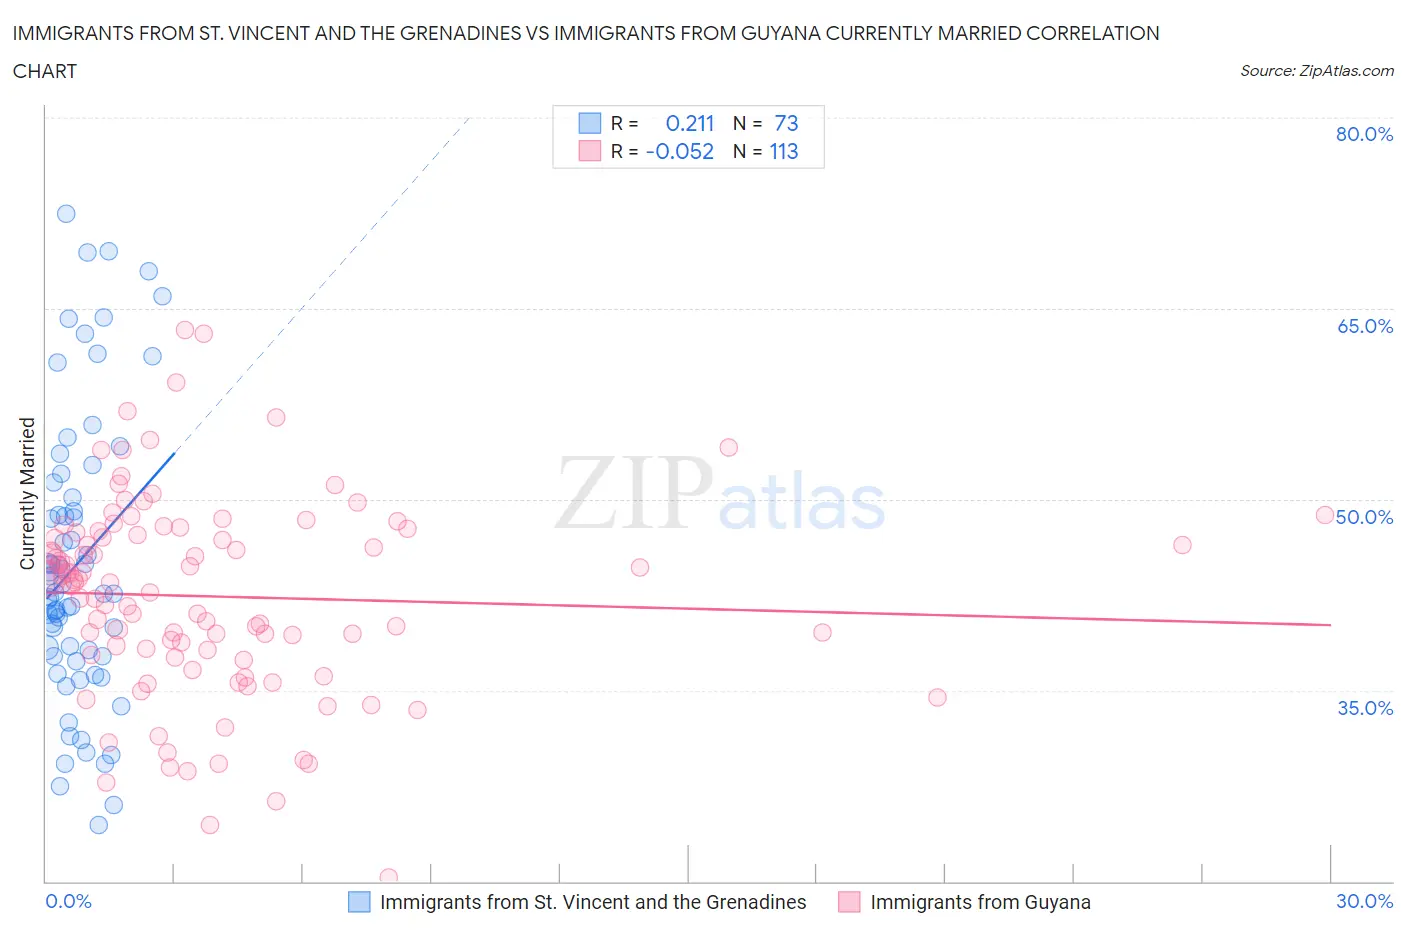
Immigrants from St. Vincent and the Grenadines vs Immigrants from Guyana Currently Married Correlation Chart
The statistical analysis conducted on geographies consisting of 56,191,418 people shows a weak positive correlation between the proportion of Immigrants from St. Vincent and the Grenadines and percentage of population currently married in the United States with a correlation coefficient (R) of 0.211 and weighted average of 40.1%. Similarly, the statistical analysis conducted on geographies consisting of 183,739,040 people shows a slight negative correlation between the proportion of Immigrants from Guyana and percentage of population currently married in the United States with a correlation coefficient (R) of -0.052 and weighted average of 41.9%, a difference of 4.5%.
Currently Married Correlation Summary
| Measurement | Immigrants from St. Vincent and the Grenadines | Immigrants from Guyana |
| Minimum | 24.4% | 20.3% |
| Maximum | 72.4% | 63.3% |
| Range | 48.0% | 43.0% |
| Mean | 44.9% | 42.4% |
| Median | 42.7% | 43.5% |
| Interquartile 25% (IQ1) | 37.7% | 37.7% |
| Interquartile 75% (IQ3) | 50.7% | 47.5% |
| Interquartile Range (IQR) | 13.0% | 9.8% |
| Standard Deviation (Sample) | 11.2% | 7.9% |
| Standard Deviation (Population) | 11.1% | 7.8% |
Similar Demographics by Currently Married
Demographics Similar to Immigrants from St. Vincent and the Grenadines by Currently Married
In terms of currently married, the demographic groups most similar to Immigrants from St. Vincent and the Grenadines are Yup'ik (39.9%, a difference of 0.39%), Puerto Rican (39.9%, a difference of 0.41%), Lumbee (39.8%, a difference of 0.57%), Immigrants from Barbados (40.3%, a difference of 0.67%), and Immigrants from Dominica (40.3%, a difference of 0.69%).
| Demographics | Rating | Rank | Currently Married |
| U.S. Virgin Islanders | 0.0 /100 | #325 | Tragic 40.7% |
| Barbadians | 0.0 /100 | #326 | Tragic 40.6% |
| Senegalese | 0.0 /100 | #327 | Tragic 40.6% |
| Arapaho | 0.0 /100 | #328 | Tragic 40.5% |
| Crow | 0.0 /100 | #329 | Tragic 40.4% |
| Immigrants | Dominica | 0.0 /100 | #330 | Tragic 40.3% |
| Immigrants | Barbados | 0.0 /100 | #331 | Tragic 40.3% |
| Immigrants | St. Vincent and the Grenadines | 0.0 /100 | #332 | Tragic 40.1% |
| Yup'ik | 0.0 /100 | #333 | Tragic 39.9% |
| Puerto Ricans | 0.0 /100 | #334 | Tragic 39.9% |
| Lumbee | 0.0 /100 | #335 | Tragic 39.8% |
| British West Indians | 0.0 /100 | #336 | Tragic 39.8% |
| Blacks/African Americans | 0.0 /100 | #337 | Tragic 39.6% |
| Cape Verdeans | 0.0 /100 | #338 | Tragic 39.6% |
| Dominicans | 0.0 /100 | #339 | Tragic 39.5% |
Demographics Similar to Immigrants from Guyana by Currently Married
In terms of currently married, the demographic groups most similar to Immigrants from Guyana are Immigrants from Trinidad and Tobago (41.9%, a difference of 0.010%), Immigrants from Bahamas (41.9%, a difference of 0.040%), African (41.8%, a difference of 0.13%), Sioux (41.9%, a difference of 0.16%), and Immigrants from Zaire (42.0%, a difference of 0.17%).
| Demographics | Rating | Rank | Currently Married |
| Liberians | 0.0 /100 | #299 | Tragic 42.2% |
| Belizeans | 0.0 /100 | #300 | Tragic 42.2% |
| Immigrants | Yemen | 0.0 /100 | #301 | Tragic 42.1% |
| Immigrants | Zaire | 0.0 /100 | #302 | Tragic 42.0% |
| Sioux | 0.0 /100 | #303 | Tragic 41.9% |
| Immigrants | Bahamas | 0.0 /100 | #304 | Tragic 41.9% |
| Immigrants | Trinidad and Tobago | 0.0 /100 | #305 | Tragic 41.9% |
| Immigrants | Guyana | 0.0 /100 | #306 | Tragic 41.9% |
| Africans | 0.0 /100 | #307 | Tragic 41.8% |
| Immigrants | Belize | 0.0 /100 | #308 | Tragic 41.8% |
| Immigrants | Liberia | 0.0 /100 | #309 | Tragic 41.8% |
| Guyanese | 0.0 /100 | #310 | Tragic 41.6% |
| Trinidadians and Tobagonians | 0.0 /100 | #311 | Tragic 41.5% |
| Somalis | 0.0 /100 | #312 | Tragic 41.5% |
| Jamaicans | 0.0 /100 | #313 | Tragic 41.4% |