Eastern European vs Immigrants from Guyana Currently Married
COMPARE
Eastern European
Immigrants from Guyana
Currently Married
Currently Married Comparison
Eastern Europeans
Immigrants from Guyana
48.9%
CURRENTLY MARRIED
99.5/ 100
METRIC RATING
30th/ 347
METRIC RANK
41.9%
CURRENTLY MARRIED
0.0/ 100
METRIC RATING
306th/ 347
METRIC RANK
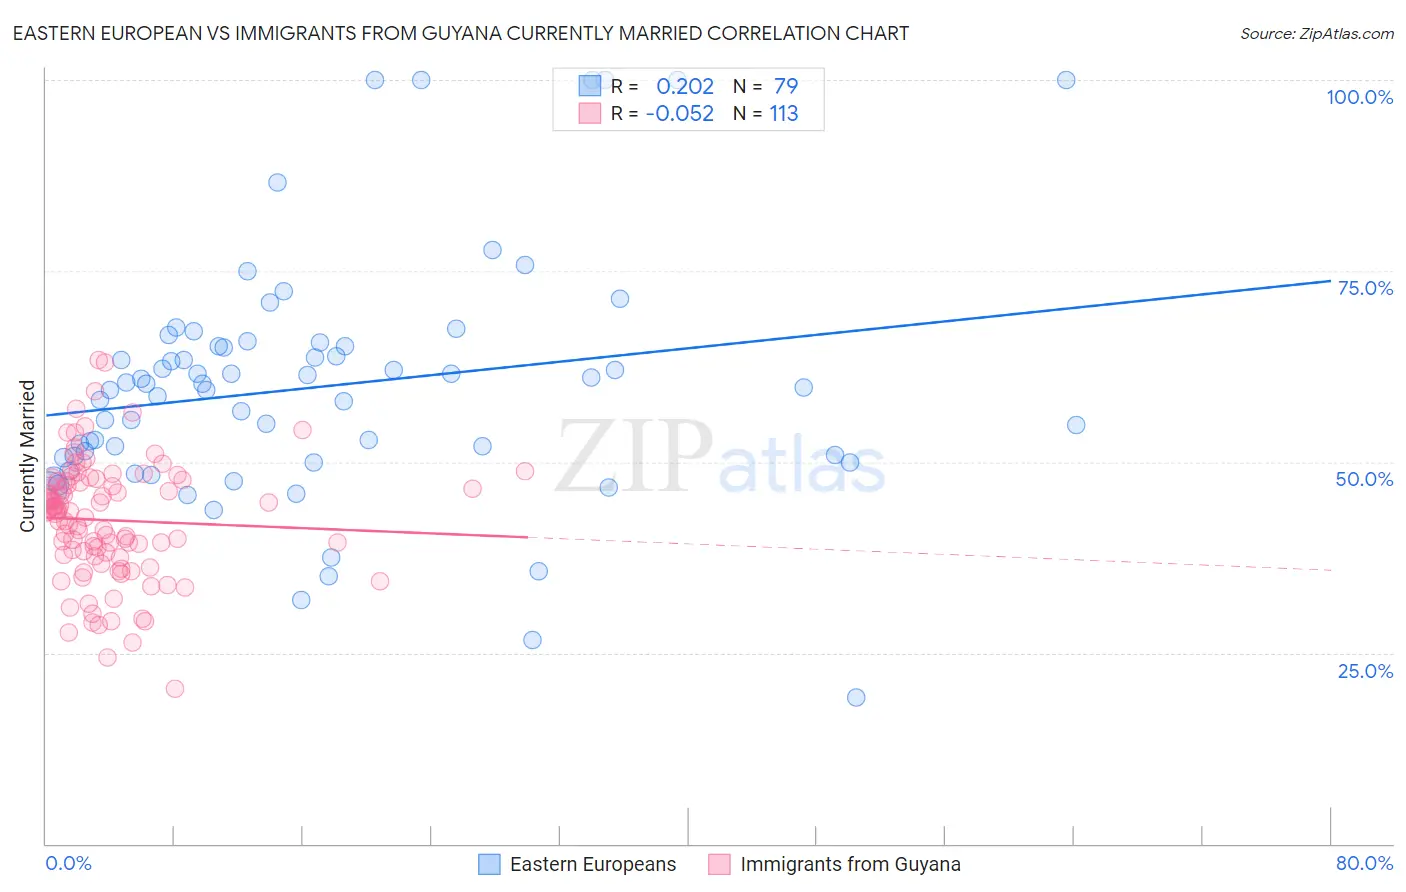
Eastern European vs Immigrants from Guyana Currently Married Correlation Chart
The statistical analysis conducted on geographies consisting of 461,211,014 people shows a weak positive correlation between the proportion of Eastern Europeans and percentage of population currently married in the United States with a correlation coefficient (R) of 0.202 and weighted average of 48.9%. Similarly, the statistical analysis conducted on geographies consisting of 183,739,040 people shows a slight negative correlation between the proportion of Immigrants from Guyana and percentage of population currently married in the United States with a correlation coefficient (R) of -0.052 and weighted average of 41.9%, a difference of 16.8%.
Currently Married Correlation Summary
| Measurement | Eastern European | Immigrants from Guyana |
| Minimum | 19.2% | 20.3% |
| Maximum | 100.0% | 63.3% |
| Range | 80.8% | 43.0% |
| Mean | 59.9% | 42.4% |
| Median | 59.8% | 43.5% |
| Interquartile 25% (IQ1) | 50.5% | 37.7% |
| Interquartile 75% (IQ3) | 65.2% | 47.5% |
| Interquartile Range (IQR) | 14.7% | 9.8% |
| Standard Deviation (Sample) | 16.1% | 7.9% |
| Standard Deviation (Population) | 16.0% | 7.8% |
Similar Demographics by Currently Married
Demographics Similar to Eastern Europeans by Currently Married
In terms of currently married, the demographic groups most similar to Eastern Europeans are Polish (48.9%, a difference of 0.0%), Croatian (48.9%, a difference of 0.010%), Immigrants from Hong Kong (48.9%, a difference of 0.010%), Irish (48.9%, a difference of 0.050%), and Welsh (48.9%, a difference of 0.060%).
| Demographics | Rating | Rank | Currently Married |
| Immigrants | Pakistan | 99.7 /100 | #23 | Exceptional 49.1% |
| Lithuanians | 99.6 /100 | #24 | Exceptional 49.0% |
| Maltese | 99.6 /100 | #25 | Exceptional 49.0% |
| Immigrants | Korea | 99.6 /100 | #26 | Exceptional 49.0% |
| Burmese | 99.6 /100 | #27 | Exceptional 48.9% |
| Welsh | 99.5 /100 | #28 | Exceptional 48.9% |
| Croatians | 99.5 /100 | #29 | Exceptional 48.9% |
| Eastern Europeans | 99.5 /100 | #30 | Exceptional 48.9% |
| Poles | 99.5 /100 | #31 | Exceptional 48.9% |
| Immigrants | Hong Kong | 99.5 /100 | #32 | Exceptional 48.9% |
| Irish | 99.5 /100 | #33 | Exceptional 48.9% |
| Immigrants | Lithuania | 99.4 /100 | #34 | Exceptional 48.8% |
| Immigrants | Northern Europe | 99.4 /100 | #35 | Exceptional 48.8% |
| Italians | 99.4 /100 | #36 | Exceptional 48.8% |
| Hungarians | 99.4 /100 | #37 | Exceptional 48.8% |
Demographics Similar to Immigrants from Guyana by Currently Married
In terms of currently married, the demographic groups most similar to Immigrants from Guyana are Immigrants from Trinidad and Tobago (41.9%, a difference of 0.010%), Immigrants from Bahamas (41.9%, a difference of 0.040%), African (41.8%, a difference of 0.13%), Sioux (41.9%, a difference of 0.16%), and Immigrants from Zaire (42.0%, a difference of 0.17%).
| Demographics | Rating | Rank | Currently Married |
| Liberians | 0.0 /100 | #299 | Tragic 42.2% |
| Belizeans | 0.0 /100 | #300 | Tragic 42.2% |
| Immigrants | Yemen | 0.0 /100 | #301 | Tragic 42.1% |
| Immigrants | Zaire | 0.0 /100 | #302 | Tragic 42.0% |
| Sioux | 0.0 /100 | #303 | Tragic 41.9% |
| Immigrants | Bahamas | 0.0 /100 | #304 | Tragic 41.9% |
| Immigrants | Trinidad and Tobago | 0.0 /100 | #305 | Tragic 41.9% |
| Immigrants | Guyana | 0.0 /100 | #306 | Tragic 41.9% |
| Africans | 0.0 /100 | #307 | Tragic 41.8% |
| Immigrants | Belize | 0.0 /100 | #308 | Tragic 41.8% |
| Immigrants | Liberia | 0.0 /100 | #309 | Tragic 41.8% |
| Guyanese | 0.0 /100 | #310 | Tragic 41.6% |
| Trinidadians and Tobagonians | 0.0 /100 | #311 | Tragic 41.5% |
| Somalis | 0.0 /100 | #312 | Tragic 41.5% |
| Jamaicans | 0.0 /100 | #313 | Tragic 41.4% |