Colville vs Immigrants from Guyana Professional Degree
COMPARE
Colville
Immigrants from Guyana
Professional Degree
Professional Degree Comparison
Colville
Immigrants from Guyana
3.8%
PROFESSIONAL DEGREE
2.6/ 100
METRIC RATING
238th/ 347
METRIC RANK
3.7%
PROFESSIONAL DEGREE
1.0/ 100
METRIC RATING
261st/ 347
METRIC RANK
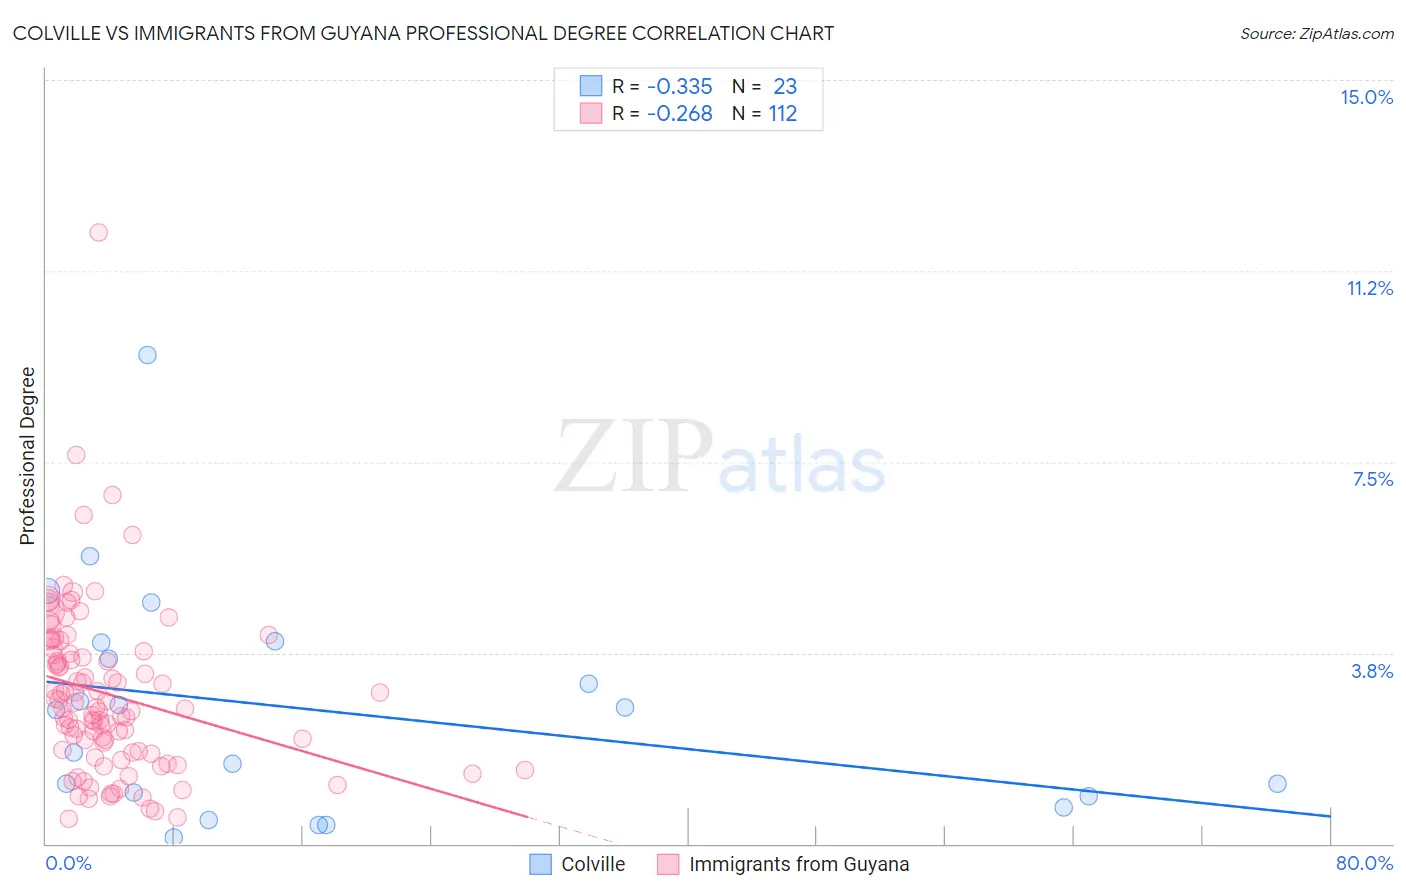
Colville vs Immigrants from Guyana Professional Degree Correlation Chart
The statistical analysis conducted on geographies consisting of 34,643,390 people shows a mild negative correlation between the proportion of Colville and percentage of population with at least professional degree education in the United States with a correlation coefficient (R) of -0.335 and weighted average of 3.8%. Similarly, the statistical analysis conducted on geographies consisting of 183,575,789 people shows a weak negative correlation between the proportion of Immigrants from Guyana and percentage of population with at least professional degree education in the United States with a correlation coefficient (R) of -0.268 and weighted average of 3.7%, a difference of 4.5%.
Professional Degree Correlation Summary
| Measurement | Colville | Immigrants from Guyana |
| Minimum | 0.12% | 0.50% |
| Maximum | 9.6% | 12.0% |
| Range | 9.5% | 11.5% |
| Mean | 2.6% | 2.9% |
| Median | 2.6% | 2.7% |
| Interquartile 25% (IQ1) | 0.93% | 1.8% |
| Interquartile 75% (IQ3) | 4.0% | 3.8% |
| Interquartile Range (IQR) | 3.0% | 2.0% |
| Standard Deviation (Sample) | 2.2% | 1.6% |
| Standard Deviation (Population) | 2.2% | 1.6% |
Similar Demographics by Professional Degree
Demographics Similar to Colville by Professional Degree
In terms of professional degree, the demographic groups most similar to Colville are British West Indian (3.8%, a difference of 0.39%), Immigrants from Ecuador (3.8%, a difference of 0.62%), Alaskan Athabascan (3.8%, a difference of 0.64%), Native Hawaiian (3.8%, a difference of 0.64%), and Guamanian/Chamorro (3.8%, a difference of 0.72%).
| Demographics | Rating | Rank | Professional Degree |
| Ecuadorians | 4.6 /100 | #231 | Tragic 3.9% |
| Cree | 4.3 /100 | #232 | Tragic 3.9% |
| Immigrants | Philippines | 4.1 /100 | #233 | Tragic 3.9% |
| Immigrants | Nonimmigrants | 4.0 /100 | #234 | Tragic 3.9% |
| Immigrants | Barbados | 4.0 /100 | #235 | Tragic 3.9% |
| Spanish Americans | 3.8 /100 | #236 | Tragic 3.9% |
| Immigrants | Trinidad and Tobago | 3.8 /100 | #237 | Tragic 3.9% |
| Colville | 2.6 /100 | #238 | Tragic 3.8% |
| British West Indians | 2.4 /100 | #239 | Tragic 3.8% |
| Immigrants | Ecuador | 2.3 /100 | #240 | Tragic 3.8% |
| Alaskan Athabascans | 2.3 /100 | #241 | Tragic 3.8% |
| Native Hawaiians | 2.3 /100 | #242 | Tragic 3.8% |
| Guamanians/Chamorros | 2.2 /100 | #243 | Tragic 3.8% |
| Immigrants | Bahamas | 2.0 /100 | #244 | Tragic 3.8% |
| French American Indians | 1.7 /100 | #245 | Tragic 3.8% |
Demographics Similar to Immigrants from Guyana by Professional Degree
In terms of professional degree, the demographic groups most similar to Immigrants from Guyana are U.S. Virgin Islander (3.7%, a difference of 0.010%), Indonesian (3.7%, a difference of 0.18%), African (3.7%, a difference of 0.19%), Immigrants from St. Vincent and the Grenadines (3.7%, a difference of 0.41%), and Bahamian (3.7%, a difference of 0.49%).
| Demographics | Rating | Rank | Professional Degree |
| Tongans | 1.3 /100 | #254 | Tragic 3.7% |
| Osage | 1.2 /100 | #255 | Tragic 3.7% |
| Iroquois | 1.2 /100 | #256 | Tragic 3.7% |
| Bahamians | 1.1 /100 | #257 | Tragic 3.7% |
| Immigrants | St. Vincent and the Grenadines | 1.1 /100 | #258 | Tragic 3.7% |
| Africans | 1.0 /100 | #259 | Tragic 3.7% |
| Indonesians | 1.0 /100 | #260 | Tragic 3.7% |
| Immigrants | Guyana | 1.0 /100 | #261 | Tragic 3.7% |
| U.S. Virgin Islanders | 1.0 /100 | #262 | Tragic 3.7% |
| Hopi | 0.9 /100 | #263 | Tragic 3.6% |
| Immigrants | Cambodia | 0.9 /100 | #264 | Tragic 3.6% |
| Immigrants | Congo | 0.8 /100 | #265 | Tragic 3.6% |
| Central American Indians | 0.8 /100 | #266 | Tragic 3.6% |
| Delaware | 0.7 /100 | #267 | Tragic 3.6% |
| Aleuts | 0.7 /100 | #268 | Tragic 3.6% |