Immigrants from Honduras vs Immigrants from Africa Currently Married
COMPARE
Immigrants from Honduras
Immigrants from Africa
Currently Married
Currently Married Comparison
Immigrants from Honduras
Immigrants from Africa
42.2%
CURRENTLY MARRIED
0.0/ 100
METRIC RATING
298th/ 347
METRIC RANK
43.9%
CURRENTLY MARRIED
0.2/ 100
METRIC RATING
257th/ 347
METRIC RANK
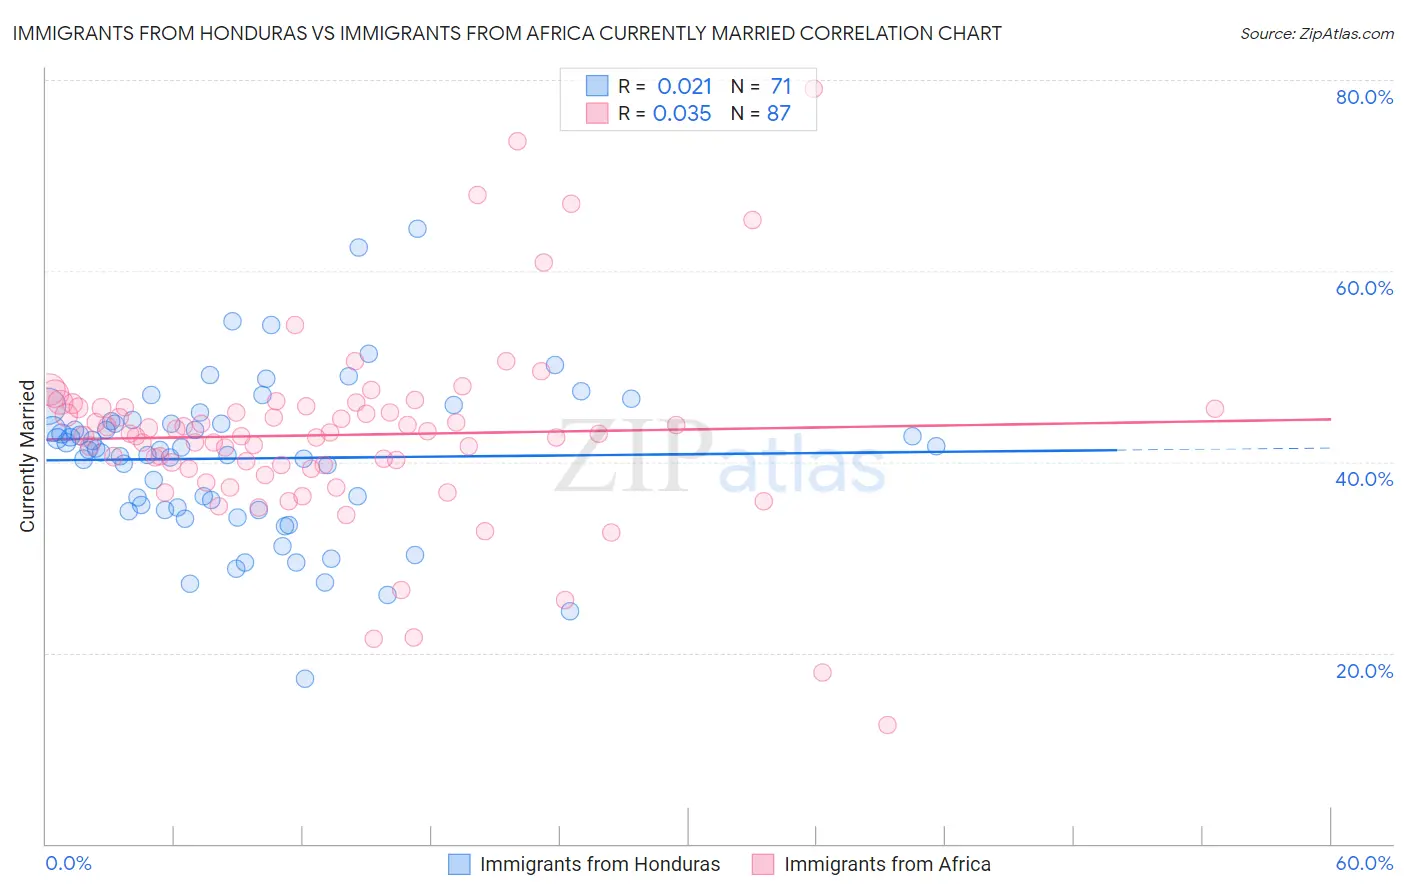
Immigrants from Honduras vs Immigrants from Africa Currently Married Correlation Chart
The statistical analysis conducted on geographies consisting of 322,599,872 people shows no correlation between the proportion of Immigrants from Honduras and percentage of population currently married in the United States with a correlation coefficient (R) of 0.021 and weighted average of 42.2%. Similarly, the statistical analysis conducted on geographies consisting of 469,352,442 people shows no correlation between the proportion of Immigrants from Africa and percentage of population currently married in the United States with a correlation coefficient (R) of 0.035 and weighted average of 43.9%, a difference of 4.0%.
Currently Married Correlation Summary
| Measurement | Immigrants from Honduras | Immigrants from Africa |
| Minimum | 17.3% | 12.5% |
| Maximum | 64.4% | 79.1% |
| Range | 47.1% | 66.6% |
| Mean | 40.4% | 42.8% |
| Median | 41.2% | 43.0% |
| Interquartile 25% (IQ1) | 34.9% | 39.3% |
| Interquartile 75% (IQ3) | 44.3% | 45.6% |
| Interquartile Range (IQR) | 9.3% | 6.4% |
| Standard Deviation (Sample) | 8.2% | 10.0% |
| Standard Deviation (Population) | 8.1% | 10.0% |
Similar Demographics by Currently Married
Demographics Similar to Immigrants from Honduras by Currently Married
In terms of currently married, the demographic groups most similar to Immigrants from Honduras are Liberian (42.2%, a difference of 0.030%), Cheyenne (42.2%, a difference of 0.090%), Belizean (42.2%, a difference of 0.13%), Menominee (42.3%, a difference of 0.20%), and Immigrants from Yemen (42.1%, a difference of 0.37%).
| Demographics | Rating | Rank | Currently Married |
| Immigrants | Guatemala | 0.0 /100 | #291 | Tragic 42.6% |
| Sub-Saharan Africans | 0.0 /100 | #292 | Tragic 42.6% |
| Yuman | 0.0 /100 | #293 | Tragic 42.6% |
| Hondurans | 0.0 /100 | #294 | Tragic 42.5% |
| Immigrants | Western Africa | 0.0 /100 | #295 | Tragic 42.4% |
| Menominee | 0.0 /100 | #296 | Tragic 42.3% |
| Cheyenne | 0.0 /100 | #297 | Tragic 42.2% |
| Immigrants | Honduras | 0.0 /100 | #298 | Tragic 42.2% |
| Liberians | 0.0 /100 | #299 | Tragic 42.2% |
| Belizeans | 0.0 /100 | #300 | Tragic 42.2% |
| Immigrants | Yemen | 0.0 /100 | #301 | Tragic 42.1% |
| Immigrants | Zaire | 0.0 /100 | #302 | Tragic 42.0% |
| Sioux | 0.0 /100 | #303 | Tragic 41.9% |
| Immigrants | Bahamas | 0.0 /100 | #304 | Tragic 41.9% |
| Immigrants | Trinidad and Tobago | 0.0 /100 | #305 | Tragic 41.9% |
Demographics Similar to Immigrants from Africa by Currently Married
In terms of currently married, the demographic groups most similar to Immigrants from Africa are Ute (43.9%, a difference of 0.010%), Shoshone (44.0%, a difference of 0.20%), Immigrants from Sierra Leone (43.8%, a difference of 0.22%), Yakama (44.0%, a difference of 0.25%), and Immigrants from Latin America (43.8%, a difference of 0.28%).
| Demographics | Rating | Rank | Currently Married |
| Immigrants | Eastern Africa | 0.3 /100 | #250 | Tragic 44.2% |
| Blackfeet | 0.3 /100 | #251 | Tragic 44.2% |
| Hispanics or Latinos | 0.3 /100 | #252 | Tragic 44.1% |
| Immigrants | Central America | 0.3 /100 | #253 | Tragic 44.1% |
| Vietnamese | 0.2 /100 | #254 | Tragic 44.0% |
| Yakama | 0.2 /100 | #255 | Tragic 44.0% |
| Shoshone | 0.2 /100 | #256 | Tragic 44.0% |
| Immigrants | Africa | 0.2 /100 | #257 | Tragic 43.9% |
| Ute | 0.2 /100 | #258 | Tragic 43.9% |
| Immigrants | Sierra Leone | 0.1 /100 | #259 | Tragic 43.8% |
| Immigrants | Latin America | 0.1 /100 | #260 | Tragic 43.8% |
| Immigrants | Nicaragua | 0.1 /100 | #261 | Tragic 43.7% |
| Bangladeshis | 0.1 /100 | #262 | Tragic 43.7% |
| Immigrants | Cuba | 0.1 /100 | #263 | Tragic 43.7% |
| Sudanese | 0.1 /100 | #264 | Tragic 43.7% |