Immigrants from Albania vs Immigrants from Africa Currently Married
COMPARE
Immigrants from Albania
Immigrants from Africa
Currently Married
Currently Married Comparison
Immigrants from Albania
Immigrants from Africa
45.9%
CURRENTLY MARRIED
14.5/ 100
METRIC RATING
202nd/ 347
METRIC RANK
43.9%
CURRENTLY MARRIED
0.2/ 100
METRIC RATING
257th/ 347
METRIC RANK
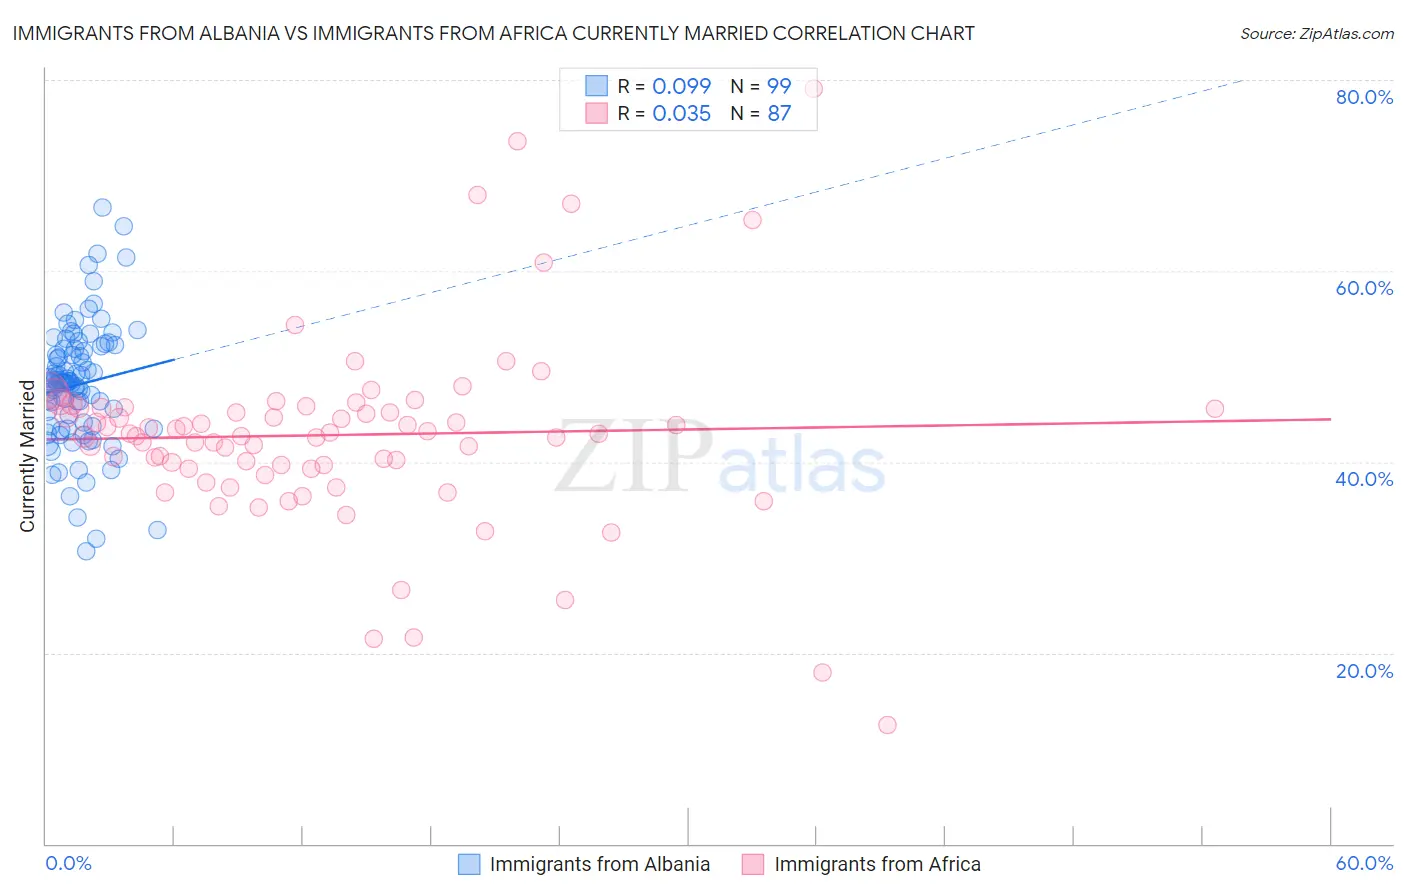
Immigrants from Albania vs Immigrants from Africa Currently Married Correlation Chart
The statistical analysis conducted on geographies consisting of 119,394,885 people shows a slight positive correlation between the proportion of Immigrants from Albania and percentage of population currently married in the United States with a correlation coefficient (R) of 0.099 and weighted average of 45.9%. Similarly, the statistical analysis conducted on geographies consisting of 469,352,442 people shows no correlation between the proportion of Immigrants from Africa and percentage of population currently married in the United States with a correlation coefficient (R) of 0.035 and weighted average of 43.9%, a difference of 4.5%.
Currently Married Correlation Summary
| Measurement | Immigrants from Albania | Immigrants from Africa |
| Minimum | 30.7% | 12.5% |
| Maximum | 66.7% | 79.1% |
| Range | 36.0% | 66.6% |
| Mean | 48.1% | 42.8% |
| Median | 48.4% | 43.0% |
| Interquartile 25% (IQ1) | 43.7% | 39.3% |
| Interquartile 75% (IQ3) | 51.9% | 45.6% |
| Interquartile Range (IQR) | 8.2% | 6.4% |
| Standard Deviation (Sample) | 6.5% | 10.0% |
| Standard Deviation (Population) | 6.4% | 10.0% |
Similar Demographics by Currently Married
Demographics Similar to Immigrants from Albania by Currently Married
In terms of currently married, the demographic groups most similar to Immigrants from Albania are Malaysian (45.9%, a difference of 0.060%), Creek (46.0%, a difference of 0.19%), Taiwanese (45.8%, a difference of 0.23%), Immigrants from Spain (45.8%, a difference of 0.24%), and South American Indian (45.8%, a difference of 0.25%).
| Demographics | Rating | Rank | Currently Married |
| Immigrants | Nepal | 23.7 /100 | #195 | Fair 46.1% |
| Immigrants | Bosnia and Herzegovina | 22.2 /100 | #196 | Fair 46.1% |
| Immigrants | Kuwait | 21.7 /100 | #197 | Fair 46.1% |
| Immigrants | Colombia | 21.0 /100 | #198 | Fair 46.1% |
| Immigrants | Costa Rica | 19.6 /100 | #199 | Poor 46.0% |
| Creek | 17.2 /100 | #200 | Poor 46.0% |
| Malaysians | 15.3 /100 | #201 | Poor 45.9% |
| Immigrants | Albania | 14.5 /100 | #202 | Poor 45.9% |
| Taiwanese | 11.7 /100 | #203 | Poor 45.8% |
| Immigrants | Spain | 11.6 /100 | #204 | Poor 45.8% |
| South American Indians | 11.5 /100 | #205 | Poor 45.8% |
| Immigrants | Immigrants | 11.2 /100 | #206 | Poor 45.8% |
| Immigrants | South America | 10.8 /100 | #207 | Poor 45.7% |
| Alsatians | 10.8 /100 | #208 | Poor 45.7% |
| Immigrants | Micronesia | 8.8 /100 | #209 | Tragic 45.6% |
Demographics Similar to Immigrants from Africa by Currently Married
In terms of currently married, the demographic groups most similar to Immigrants from Africa are Ute (43.9%, a difference of 0.010%), Shoshone (44.0%, a difference of 0.20%), Immigrants from Sierra Leone (43.8%, a difference of 0.22%), Yakama (44.0%, a difference of 0.25%), and Immigrants from Latin America (43.8%, a difference of 0.28%).
| Demographics | Rating | Rank | Currently Married |
| Immigrants | Eastern Africa | 0.3 /100 | #250 | Tragic 44.2% |
| Blackfeet | 0.3 /100 | #251 | Tragic 44.2% |
| Hispanics or Latinos | 0.3 /100 | #252 | Tragic 44.1% |
| Immigrants | Central America | 0.3 /100 | #253 | Tragic 44.1% |
| Vietnamese | 0.2 /100 | #254 | Tragic 44.0% |
| Yakama | 0.2 /100 | #255 | Tragic 44.0% |
| Shoshone | 0.2 /100 | #256 | Tragic 44.0% |
| Immigrants | Africa | 0.2 /100 | #257 | Tragic 43.9% |
| Ute | 0.2 /100 | #258 | Tragic 43.9% |
| Immigrants | Sierra Leone | 0.1 /100 | #259 | Tragic 43.8% |
| Immigrants | Latin America | 0.1 /100 | #260 | Tragic 43.8% |
| Immigrants | Nicaragua | 0.1 /100 | #261 | Tragic 43.7% |
| Bangladeshis | 0.1 /100 | #262 | Tragic 43.7% |
| Immigrants | Cuba | 0.1 /100 | #263 | Tragic 43.7% |
| Sudanese | 0.1 /100 | #264 | Tragic 43.7% |