Immigrants from Western Europe vs Immigrants from Africa Currently Married
COMPARE
Immigrants from Western Europe
Immigrants from Africa
Currently Married
Currently Married Comparison
Immigrants from Western Europe
Immigrants from Africa
47.6%
CURRENTLY MARRIED
91.1/ 100
METRIC RATING
112th/ 347
METRIC RANK
43.9%
CURRENTLY MARRIED
0.2/ 100
METRIC RATING
257th/ 347
METRIC RANK
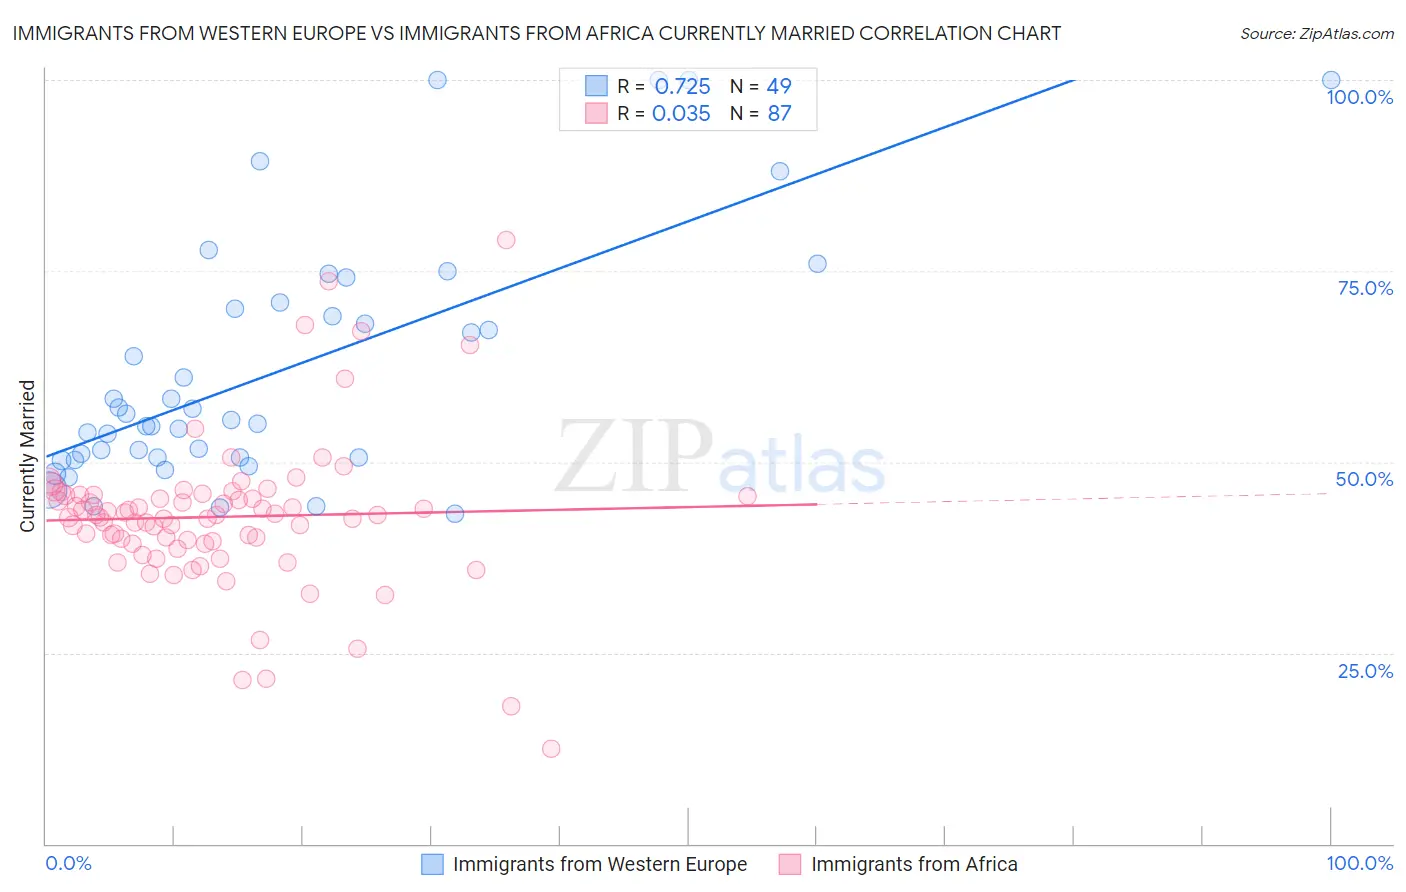
Immigrants from Western Europe vs Immigrants from Africa Currently Married Correlation Chart
The statistical analysis conducted on geographies consisting of 494,018,358 people shows a strong positive correlation between the proportion of Immigrants from Western Europe and percentage of population currently married in the United States with a correlation coefficient (R) of 0.725 and weighted average of 47.6%. Similarly, the statistical analysis conducted on geographies consisting of 469,352,442 people shows no correlation between the proportion of Immigrants from Africa and percentage of population currently married in the United States with a correlation coefficient (R) of 0.035 and weighted average of 43.9%, a difference of 8.5%.
Currently Married Correlation Summary
| Measurement | Immigrants from Western Europe | Immigrants from Africa |
| Minimum | 43.2% | 12.5% |
| Maximum | 100.0% | 79.1% |
| Range | 56.8% | 66.6% |
| Mean | 61.9% | 42.8% |
| Median | 55.4% | 43.0% |
| Interquartile 25% (IQ1) | 50.5% | 39.3% |
| Interquartile 75% (IQ3) | 70.5% | 45.6% |
| Interquartile Range (IQR) | 19.9% | 6.4% |
| Standard Deviation (Sample) | 16.0% | 10.0% |
| Standard Deviation (Population) | 15.8% | 10.0% |
Similar Demographics by Currently Married
Demographics Similar to Immigrants from Western Europe by Currently Married
In terms of currently married, the demographic groups most similar to Immigrants from Western Europe are Immigrants from Hungary (47.6%, a difference of 0.010%), Immigrants from Denmark (47.6%, a difference of 0.030%), South African (47.6%, a difference of 0.060%), Immigrants from Indonesia (47.6%, a difference of 0.070%), and Palestinian (47.6%, a difference of 0.070%).
| Demographics | Rating | Rank | Currently Married |
| Immigrants | Singapore | 93.3 /100 | #105 | Exceptional 47.8% |
| Immigrants | Greece | 93.1 /100 | #106 | Exceptional 47.7% |
| Immigrants | Italy | 92.9 /100 | #107 | Exceptional 47.7% |
| Tsimshian | 92.4 /100 | #108 | Exceptional 47.7% |
| Immigrants | Egypt | 92.3 /100 | #109 | Exceptional 47.7% |
| Immigrants | Russia | 92.0 /100 | #110 | Exceptional 47.7% |
| Immigrants | Hungary | 91.2 /100 | #111 | Exceptional 47.6% |
| Immigrants | Western Europe | 91.1 /100 | #112 | Exceptional 47.6% |
| Immigrants | Denmark | 90.9 /100 | #113 | Exceptional 47.6% |
| South Africans | 90.5 /100 | #114 | Exceptional 47.6% |
| Immigrants | Indonesia | 90.5 /100 | #115 | Exceptional 47.6% |
| Palestinians | 90.4 /100 | #116 | Exceptional 47.6% |
| Puget Sound Salish | 90.3 /100 | #117 | Exceptional 47.6% |
| Immigrants | Philippines | 90.2 /100 | #118 | Exceptional 47.6% |
| Australians | 90.2 /100 | #119 | Exceptional 47.6% |
Demographics Similar to Immigrants from Africa by Currently Married
In terms of currently married, the demographic groups most similar to Immigrants from Africa are Ute (43.9%, a difference of 0.010%), Shoshone (44.0%, a difference of 0.20%), Immigrants from Sierra Leone (43.8%, a difference of 0.22%), Yakama (44.0%, a difference of 0.25%), and Immigrants from Latin America (43.8%, a difference of 0.28%).
| Demographics | Rating | Rank | Currently Married |
| Immigrants | Eastern Africa | 0.3 /100 | #250 | Tragic 44.2% |
| Blackfeet | 0.3 /100 | #251 | Tragic 44.2% |
| Hispanics or Latinos | 0.3 /100 | #252 | Tragic 44.1% |
| Immigrants | Central America | 0.3 /100 | #253 | Tragic 44.1% |
| Vietnamese | 0.2 /100 | #254 | Tragic 44.0% |
| Yakama | 0.2 /100 | #255 | Tragic 44.0% |
| Shoshone | 0.2 /100 | #256 | Tragic 44.0% |
| Immigrants | Africa | 0.2 /100 | #257 | Tragic 43.9% |
| Ute | 0.2 /100 | #258 | Tragic 43.9% |
| Immigrants | Sierra Leone | 0.1 /100 | #259 | Tragic 43.8% |
| Immigrants | Latin America | 0.1 /100 | #260 | Tragic 43.8% |
| Immigrants | Nicaragua | 0.1 /100 | #261 | Tragic 43.7% |
| Bangladeshis | 0.1 /100 | #262 | Tragic 43.7% |
| Immigrants | Cuba | 0.1 /100 | #263 | Tragic 43.7% |
| Sudanese | 0.1 /100 | #264 | Tragic 43.7% |