Colville vs Asian Divorced or Separated
COMPARE
Colville
Asian
Divorced or Separated
Divorced or Separated Comparison
Colville
Asians
14.2%
DIVORCED OR SEPARATED
0.0/ 100
METRIC RATING
339th/ 347
METRIC RANK
10.6%
DIVORCED OR SEPARATED
100.0/ 100
METRIC RATING
19th/ 347
METRIC RANK
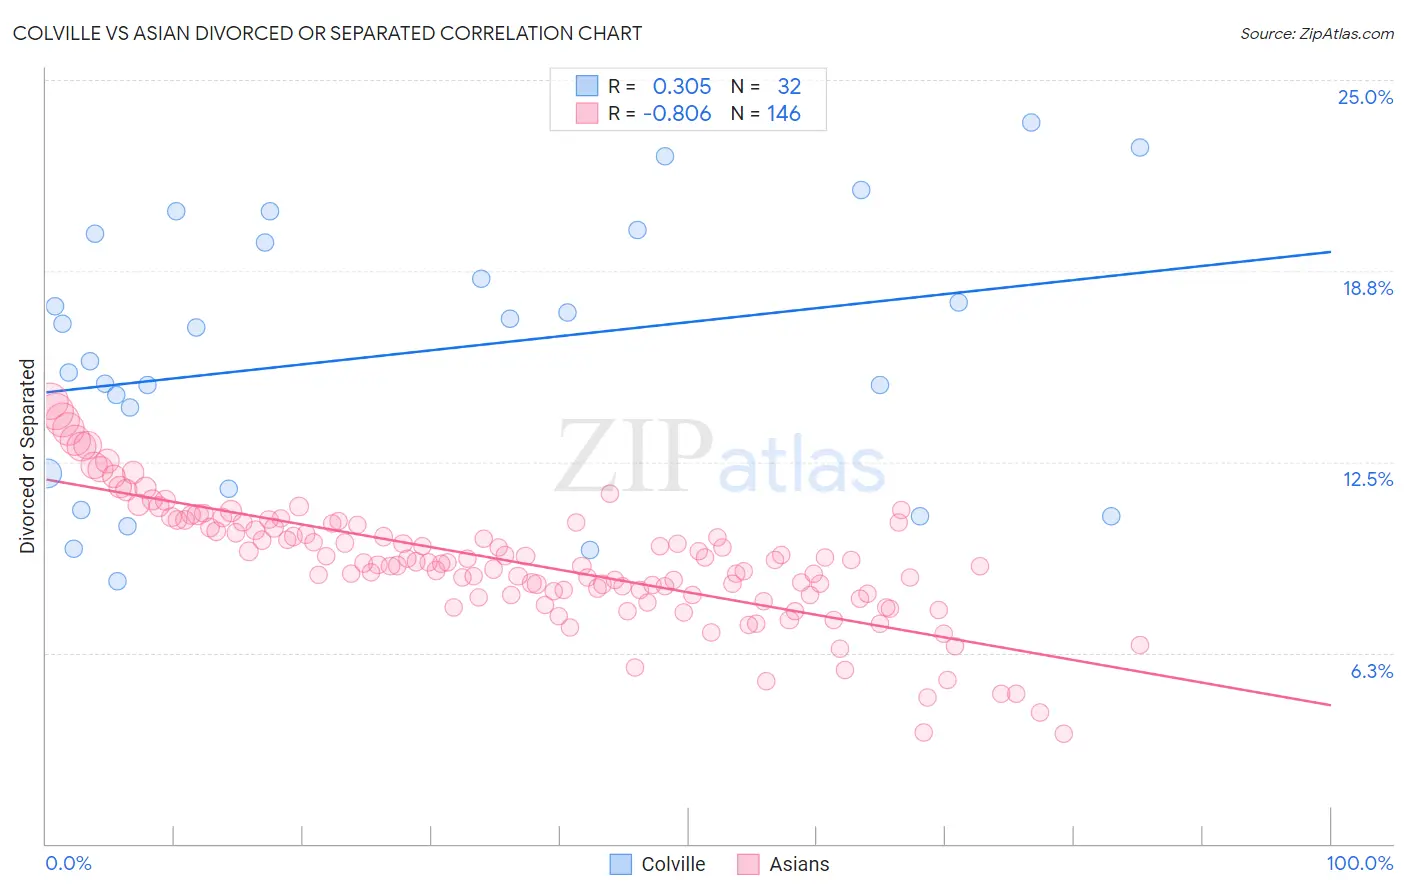
Colville vs Asian Divorced or Separated Correlation Chart
The statistical analysis conducted on geographies consisting of 34,683,925 people shows a mild positive correlation between the proportion of Colville and percentage of population currently divorced or separated in the United States with a correlation coefficient (R) of 0.305 and weighted average of 14.2%. Similarly, the statistical analysis conducted on geographies consisting of 550,451,547 people shows a very strong negative correlation between the proportion of Asians and percentage of population currently divorced or separated in the United States with a correlation coefficient (R) of -0.806 and weighted average of 10.6%, a difference of 33.5%.
Divorced or Separated Correlation Summary
| Measurement | Colville | Asian |
| Minimum | 8.6% | 3.6% |
| Maximum | 23.6% | 14.5% |
| Range | 15.0% | 10.9% |
| Mean | 16.0% | 9.2% |
| Median | 16.4% | 9.2% |
| Interquartile 25% (IQ1) | 11.9% | 8.2% |
| Interquartile 75% (IQ3) | 19.8% | 10.5% |
| Interquartile Range (IQR) | 8.0% | 2.3% |
| Standard Deviation (Sample) | 4.3% | 2.0% |
| Standard Deviation (Population) | 4.2% | 2.0% |
Similar Demographics by Divorced or Separated
Demographics Similar to Colville by Divorced or Separated
In terms of divorced or separated, the demographic groups most similar to Colville are Chickasaw (14.2%, a difference of 0.040%), Bahamian (14.2%, a difference of 0.24%), Seminole (14.3%, a difference of 0.40%), Choctaw (14.1%, a difference of 0.53%), and Crow (14.1%, a difference of 0.84%).
| Demographics | Rating | Rank | Divorced or Separated |
| Cherokee | 0.0 /100 | #332 | Tragic 13.7% |
| Puerto Ricans | 0.0 /100 | #333 | Tragic 13.9% |
| Immigrants | Bahamas | 0.0 /100 | #334 | Tragic 13.9% |
| Dutch West Indians | 0.0 /100 | #335 | Tragic 14.0% |
| Shoshone | 0.0 /100 | #336 | Tragic 14.0% |
| Crow | 0.0 /100 | #337 | Tragic 14.1% |
| Choctaw | 0.0 /100 | #338 | Tragic 14.1% |
| Colville | 0.0 /100 | #339 | Tragic 14.2% |
| Chickasaw | 0.0 /100 | #340 | Tragic 14.2% |
| Bahamians | 0.0 /100 | #341 | Tragic 14.2% |
| Seminole | 0.0 /100 | #342 | Tragic 14.3% |
| Creek | 0.0 /100 | #343 | Tragic 14.4% |
| Cubans | 0.0 /100 | #344 | Tragic 14.5% |
| Kiowa | 0.0 /100 | #345 | Tragic 14.5% |
| Arapaho | 0.0 /100 | #346 | Tragic 14.8% |
Demographics Similar to Asians by Divorced or Separated
In terms of divorced or separated, the demographic groups most similar to Asians are Immigrants from Iran (10.6%, a difference of 0.0%), Immigrants from Israel (10.6%, a difference of 0.090%), Immigrants from Korea (10.6%, a difference of 0.20%), Immigrants from Armenia (10.6%, a difference of 0.64%), and Assyrian/Chaldean/Syriac (10.6%, a difference of 0.71%).
| Demographics | Rating | Rank | Divorced or Separated |
| Okinawans | 100.0 /100 | #12 | Exceptional 10.5% |
| Cypriots | 100.0 /100 | #13 | Exceptional 10.5% |
| Assyrians/Chaldeans/Syriacs | 100.0 /100 | #14 | Exceptional 10.6% |
| Immigrants | Armenia | 100.0 /100 | #15 | Exceptional 10.6% |
| Immigrants | Korea | 100.0 /100 | #16 | Exceptional 10.6% |
| Immigrants | Israel | 100.0 /100 | #17 | Exceptional 10.6% |
| Immigrants | Iran | 100.0 /100 | #18 | Exceptional 10.6% |
| Asians | 100.0 /100 | #19 | Exceptional 10.6% |
| Burmese | 100.0 /100 | #20 | Exceptional 10.7% |
| Immigrants | Asia | 100.0 /100 | #21 | Exceptional 10.7% |
| Vietnamese | 100.0 /100 | #22 | Exceptional 10.8% |
| Immigrants | Pakistan | 100.0 /100 | #23 | Exceptional 10.8% |
| Immigrants | Sri Lanka | 100.0 /100 | #24 | Exceptional 10.8% |
| Iranians | 100.0 /100 | #25 | Exceptional 10.8% |
| Immigrants | Indonesia | 100.0 /100 | #26 | Exceptional 10.9% |