Chippewa vs Pueblo Average Family Size
COMPARE
Chippewa
Pueblo
Average Family Size
Average Family Size Comparison
Chippewa
Pueblo
3.20
AVERAGE FAMILY SIZE
13.3/ 100
METRIC RATING
208th/ 347
METRIC RANK
3.79
AVERAGE FAMILY SIZE
100/ 100
METRIC RATING
3rd/ 347
METRIC RANK
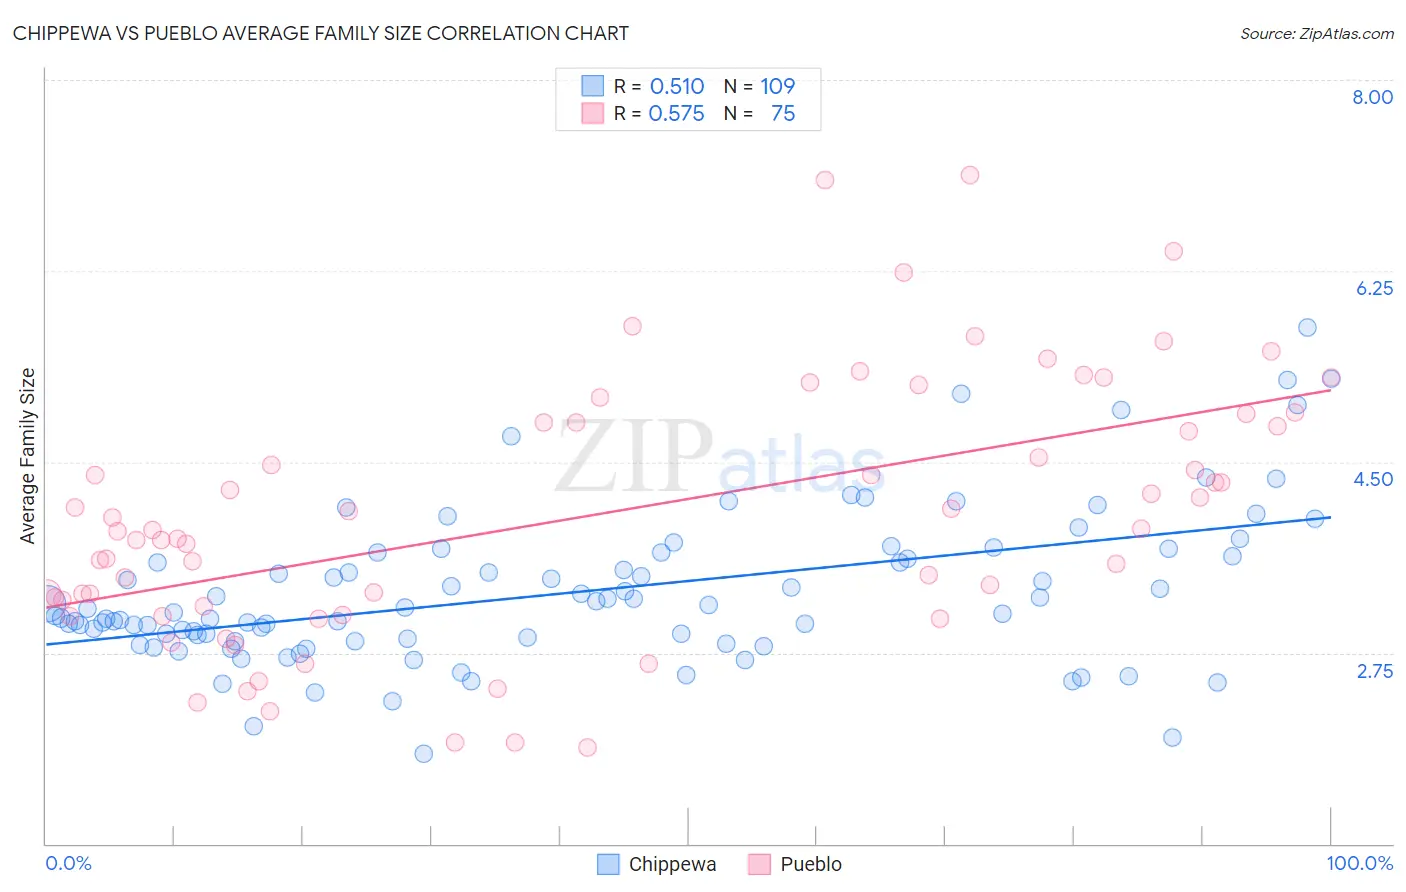
Chippewa vs Pueblo Average Family Size Correlation Chart
The statistical analysis conducted on geographies consisting of 215,001,181 people shows a substantial positive correlation between the proportion of Chippewa and average family size in the United States with a correlation coefficient (R) of 0.510 and weighted average of 3.20. Similarly, the statistical analysis conducted on geographies consisting of 120,067,636 people shows a substantial positive correlation between the proportion of Pueblo and average family size in the United States with a correlation coefficient (R) of 0.575 and weighted average of 3.79, a difference of 18.5%.
Average Family Size Correlation Summary
| Measurement | Chippewa | Pueblo |
| Minimum | 1.83 | 1.88 |
| Maximum | 5.73 | 7.13 |
| Range | 3.90 | 5.25 |
| Mean | 3.30 | 4.02 |
| Median | 3.12 | 3.88 |
| Interquartile 25% (IQ1) | 2.87 | 3.17 |
| Interquartile 75% (IQ3) | 3.65 | 4.86 |
| Interquartile Range (IQR) | 0.78 | 1.69 |
| Standard Deviation (Sample) | 0.71 | 1.18 |
| Standard Deviation (Population) | 0.70 | 1.18 |
Similar Demographics by Average Family Size
Demographics Similar to Chippewa by Average Family Size
In terms of average family size, the demographic groups most similar to Chippewa are Sudanese (3.20, a difference of 0.0%), Filipino (3.20, a difference of 0.010%), Zimbabwean (3.20, a difference of 0.030%), Immigrants from Iran (3.20, a difference of 0.050%), and Creek (3.20, a difference of 0.050%).
| Demographics | Rating | Rank | Average Family Size |
| Immigrants | Morocco | 18.5 /100 | #201 | Poor 3.21 |
| Immigrants | India | 18.5 /100 | #202 | Poor 3.21 |
| Immigrants | Nepal | 18.1 /100 | #203 | Poor 3.21 |
| Immigrants | Poland | 16.6 /100 | #204 | Poor 3.20 |
| Paraguayans | 16.3 /100 | #205 | Poor 3.20 |
| Immigrants | Cabo Verde | 16.0 /100 | #206 | Poor 3.20 |
| Filipinos | 13.6 /100 | #207 | Poor 3.20 |
| Chippewa | 13.3 /100 | #208 | Poor 3.20 |
| Sudanese | 13.3 /100 | #209 | Poor 3.20 |
| Zimbabweans | 12.6 /100 | #210 | Poor 3.20 |
| Immigrants | Iran | 12.1 /100 | #211 | Poor 3.20 |
| Creek | 12.1 /100 | #212 | Poor 3.20 |
| Mongolians | 11.5 /100 | #213 | Poor 3.20 |
| Somalis | 11.2 /100 | #214 | Poor 3.20 |
| Delaware | 11.1 /100 | #215 | Poor 3.20 |
Demographics Similar to Pueblo by Average Family Size
In terms of average family size, the demographic groups most similar to Pueblo are Crow (3.82, a difference of 0.81%), Pima (3.75, a difference of 1.3%), Navajo (3.65, a difference of 4.1%), Arapaho (3.64, a difference of 4.4%), and Inupiat (3.63, a difference of 4.6%).
| Demographics | Rating | Rank | Average Family Size |
| Yup'ik | 100 /100 | #1 | Exceptional 4.00 |
| Crow | 100 /100 | #2 | Exceptional 3.82 |
| Pueblo | 100 /100 | #3 | Exceptional 3.79 |
| Pima | 100 /100 | #4 | Exceptional 3.75 |
| Navajo | 100.0 /100 | #5 | Exceptional 3.65 |
| Arapaho | 100.0 /100 | #6 | Exceptional 3.64 |
| Inupiat | 100.0 /100 | #7 | Exceptional 3.63 |
| Immigrants | Yemen | 100.0 /100 | #8 | Exceptional 3.60 |
| Hopi | 100.0 /100 | #9 | Exceptional 3.60 |
| Spanish American Indians | 100.0 /100 | #10 | Exceptional 3.58 |
| Tohono O'odham | 100.0 /100 | #11 | Exceptional 3.53 |
| Immigrants | Mexico | 100.0 /100 | #12 | Exceptional 3.52 |
| Sioux | 100.0 /100 | #13 | Exceptional 3.52 |
| Immigrants | Central America | 100.0 /100 | #14 | Exceptional 3.49 |
| Tongans | 100.0 /100 | #15 | Exceptional 3.49 |