Chippewa vs Carpatho Rusyn Average Family Size
COMPARE
Chippewa
Carpatho Rusyn
Average Family Size
Average Family Size Comparison
Chippewa
Carpatho Rusyns
3.20
AVERAGE FAMILY SIZE
13.3/ 100
METRIC RATING
208th/ 347
METRIC RANK
3.06
AVERAGE FAMILY SIZE
0.0/ 100
METRIC RATING
347th/ 347
METRIC RANK
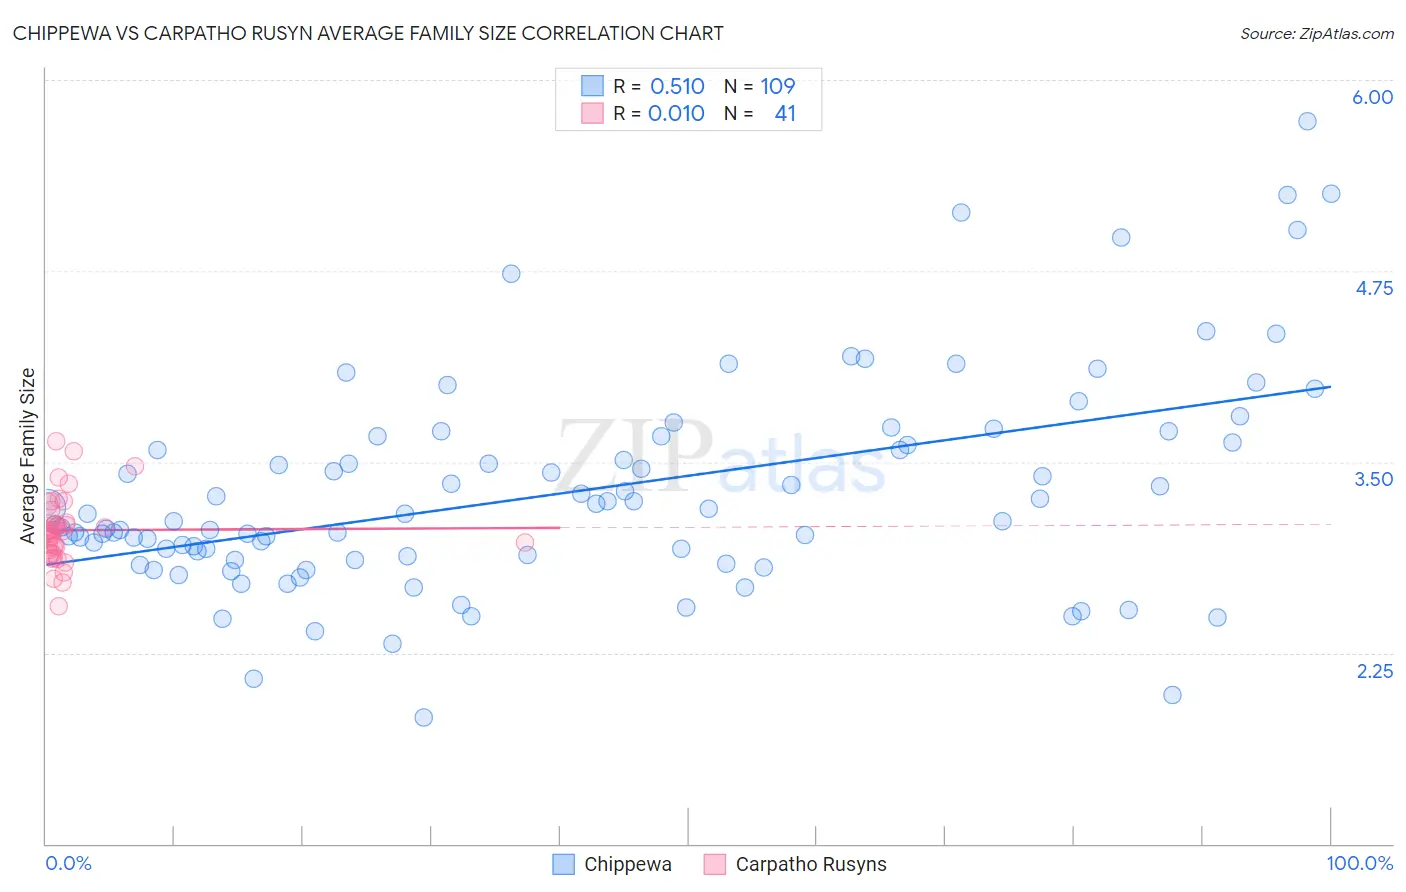
Chippewa vs Carpatho Rusyn Average Family Size Correlation Chart
The statistical analysis conducted on geographies consisting of 215,001,181 people shows a substantial positive correlation between the proportion of Chippewa and average family size in the United States with a correlation coefficient (R) of 0.510 and weighted average of 3.20. Similarly, the statistical analysis conducted on geographies consisting of 58,871,605 people shows no correlation between the proportion of Carpatho Rusyns and average family size in the United States with a correlation coefficient (R) of 0.010 and weighted average of 3.06, a difference of 4.5%.
Average Family Size Correlation Summary
| Measurement | Chippewa | Carpatho Rusyn |
| Minimum | 1.83 | 2.56 |
| Maximum | 5.73 | 3.64 |
| Range | 3.90 | 1.08 |
| Mean | 3.30 | 3.05 |
| Median | 3.12 | 3.05 |
| Interquartile 25% (IQ1) | 2.87 | 2.91 |
| Interquartile 75% (IQ3) | 3.65 | 3.14 |
| Interquartile Range (IQR) | 0.78 | 0.23 |
| Standard Deviation (Sample) | 0.71 | 0.22 |
| Standard Deviation (Population) | 0.70 | 0.22 |
Similar Demographics by Average Family Size
Demographics Similar to Chippewa by Average Family Size
In terms of average family size, the demographic groups most similar to Chippewa are Sudanese (3.20, a difference of 0.0%), Filipino (3.20, a difference of 0.010%), Zimbabwean (3.20, a difference of 0.030%), Immigrants from Iran (3.20, a difference of 0.050%), and Creek (3.20, a difference of 0.050%).
| Demographics | Rating | Rank | Average Family Size |
| Immigrants | Morocco | 18.5 /100 | #201 | Poor 3.21 |
| Immigrants | India | 18.5 /100 | #202 | Poor 3.21 |
| Immigrants | Nepal | 18.1 /100 | #203 | Poor 3.21 |
| Immigrants | Poland | 16.6 /100 | #204 | Poor 3.20 |
| Paraguayans | 16.3 /100 | #205 | Poor 3.20 |
| Immigrants | Cabo Verde | 16.0 /100 | #206 | Poor 3.20 |
| Filipinos | 13.6 /100 | #207 | Poor 3.20 |
| Chippewa | 13.3 /100 | #208 | Poor 3.20 |
| Sudanese | 13.3 /100 | #209 | Poor 3.20 |
| Zimbabweans | 12.6 /100 | #210 | Poor 3.20 |
| Immigrants | Iran | 12.1 /100 | #211 | Poor 3.20 |
| Creek | 12.1 /100 | #212 | Poor 3.20 |
| Mongolians | 11.5 /100 | #213 | Poor 3.20 |
| Somalis | 11.2 /100 | #214 | Poor 3.20 |
| Delaware | 11.1 /100 | #215 | Poor 3.20 |
Demographics Similar to Carpatho Rusyns by Average Family Size
In terms of average family size, the demographic groups most similar to Carpatho Rusyns are Slovak (3.06, a difference of 0.060%), Slovene (3.07, a difference of 0.35%), French Canadian (3.07, a difference of 0.39%), Norwegian (3.08, a difference of 0.63%), and German (3.09, a difference of 0.86%).
| Demographics | Rating | Rank | Average Family Size |
| Estonians | 0.0 /100 | #333 | Tragic 3.10 |
| Lithuanians | 0.0 /100 | #334 | Tragic 3.10 |
| Luxembourgers | 0.0 /100 | #335 | Tragic 3.10 |
| Irish | 0.0 /100 | #336 | Tragic 3.10 |
| Swedes | 0.0 /100 | #337 | Tragic 3.10 |
| French | 0.0 /100 | #338 | Tragic 3.10 |
| Croatians | 0.0 /100 | #339 | Tragic 3.10 |
| Finns | 0.0 /100 | #340 | Tragic 3.09 |
| Poles | 0.0 /100 | #341 | Tragic 3.09 |
| Germans | 0.0 /100 | #342 | Tragic 3.09 |
| Norwegians | 0.0 /100 | #343 | Tragic 3.08 |
| French Canadians | 0.0 /100 | #344 | Tragic 3.07 |
| Slovenes | 0.0 /100 | #345 | Tragic 3.07 |
| Slovaks | 0.0 /100 | #346 | Tragic 3.06 |
| Carpatho Rusyns | 0.0 /100 | #347 | Tragic 3.06 |