Cheyenne vs Immigrants from Albania Single Mother Households
COMPARE
Cheyenne
Immigrants from Albania
Single Mother Households
Single Mother Households Comparison
Cheyenne
Immigrants from Albania
8.1%
SINGLE MOTHER HOUSEHOLDS
0.0/ 100
METRIC RATING
309th/ 347
METRIC RANK
6.1%
SINGLE MOTHER HOUSEHOLDS
81.5/ 100
METRIC RATING
149th/ 347
METRIC RANK
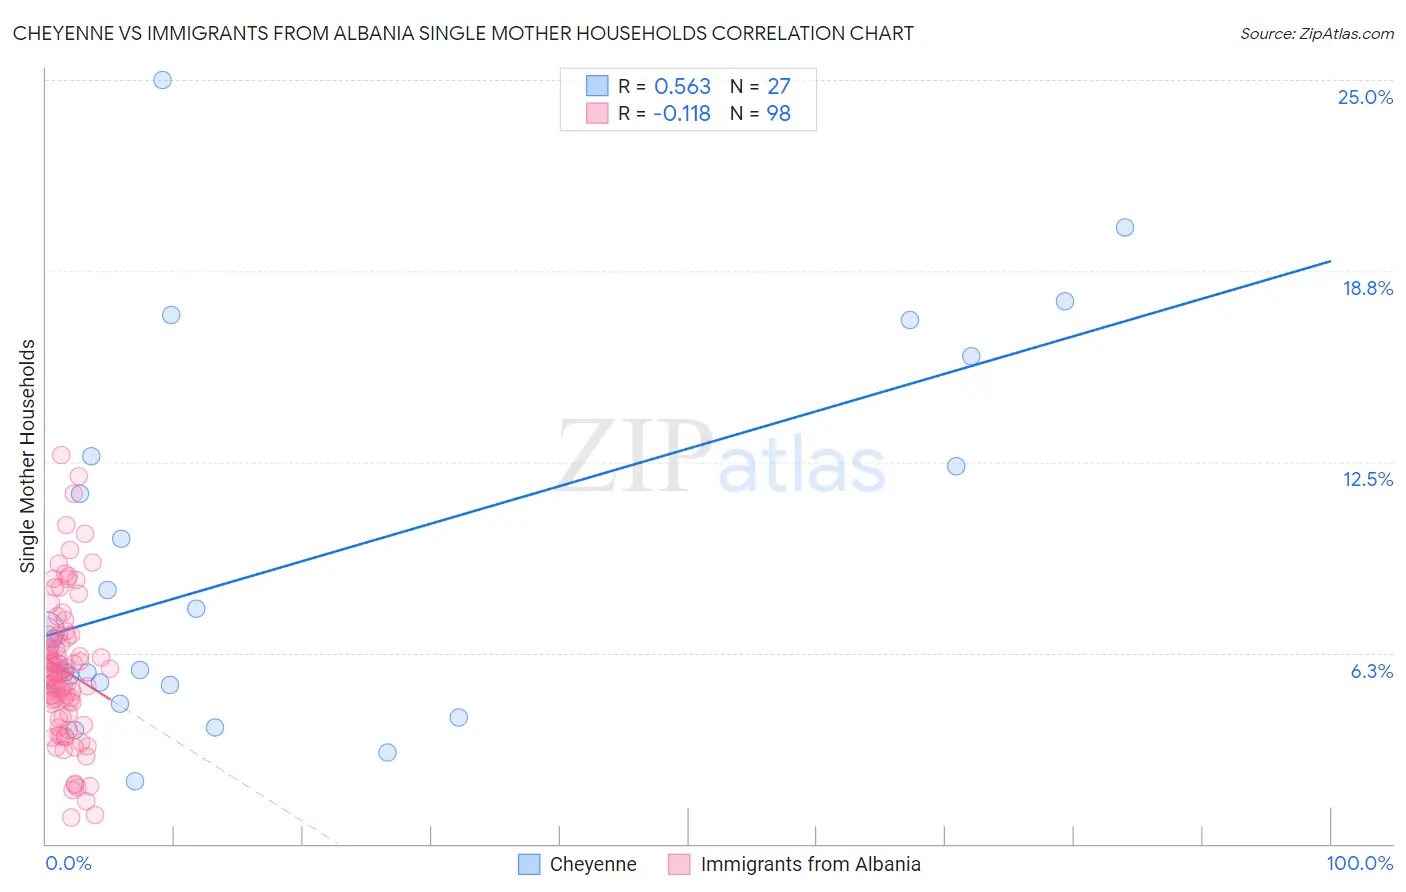
Cheyenne vs Immigrants from Albania Single Mother Households Correlation Chart
The statistical analysis conducted on geographies consisting of 80,615,278 people shows a substantial positive correlation between the proportion of Cheyenne and percentage of single mother households in the United States with a correlation coefficient (R) of 0.563 and weighted average of 8.1%. Similarly, the statistical analysis conducted on geographies consisting of 119,328,901 people shows a poor negative correlation between the proportion of Immigrants from Albania and percentage of single mother households in the United States with a correlation coefficient (R) of -0.118 and weighted average of 6.1%, a difference of 33.6%.
Single Mother Households Correlation Summary
| Measurement | Cheyenne | Immigrants from Albania |
| Minimum | 2.1% | 0.85% |
| Maximum | 25.0% | 12.7% |
| Range | 22.9% | 11.9% |
| Mean | 9.2% | 5.7% |
| Median | 6.7% | 5.5% |
| Interquartile 25% (IQ1) | 5.2% | 4.2% |
| Interquartile 75% (IQ3) | 12.7% | 6.8% |
| Interquartile Range (IQR) | 7.5% | 2.6% |
| Standard Deviation (Sample) | 6.0% | 2.3% |
| Standard Deviation (Population) | 5.9% | 2.3% |
Similar Demographics by Single Mother Households
Demographics Similar to Cheyenne by Single Mother Households
In terms of single mother households, the demographic groups most similar to Cheyenne are Honduran (8.1%, a difference of 0.050%), Immigrants from Congo (8.1%, a difference of 0.35%), Immigrants from Central America (8.1%, a difference of 0.44%), Immigrants from St. Vincent and the Grenadines (8.0%, a difference of 0.46%), and Bangladeshi (8.1%, a difference of 0.64%).
| Demographics | Rating | Rank | Single Mother Households |
| Immigrants | Ghana | 0.0 /100 | #302 | Tragic 8.0% |
| Immigrants | Bahamas | 0.0 /100 | #303 | Tragic 8.0% |
| Natives/Alaskans | 0.0 /100 | #304 | Tragic 8.0% |
| Colville | 0.0 /100 | #305 | Tragic 8.0% |
| Immigrants | Barbados | 0.0 /100 | #306 | Tragic 8.0% |
| Immigrants | St. Vincent and the Grenadines | 0.0 /100 | #307 | Tragic 8.0% |
| Immigrants | Central America | 0.0 /100 | #308 | Tragic 8.1% |
| Cheyenne | 0.0 /100 | #309 | Tragic 8.1% |
| Hondurans | 0.0 /100 | #310 | Tragic 8.1% |
| Immigrants | Congo | 0.0 /100 | #311 | Tragic 8.1% |
| Bangladeshis | 0.0 /100 | #312 | Tragic 8.1% |
| Immigrants | Grenada | 0.0 /100 | #313 | Tragic 8.2% |
| Immigrants | Mexico | 0.0 /100 | #314 | Tragic 8.2% |
| Immigrants | Western Africa | 0.0 /100 | #315 | Tragic 8.2% |
| Africans | 0.0 /100 | #316 | Tragic 8.2% |
Demographics Similar to Immigrants from Albania by Single Mother Households
In terms of single mother households, the demographic groups most similar to Immigrants from Albania are Scotch-Irish (6.0%, a difference of 0.10%), Zimbabwean (6.1%, a difference of 0.14%), Immigrants from Jordan (6.0%, a difference of 0.15%), Immigrants from Southern Europe (6.1%, a difference of 0.19%), and French Canadian (6.0%, a difference of 0.21%).
| Demographics | Rating | Rank | Single Mother Households |
| Immigrants | Egypt | 85.0 /100 | #142 | Excellent 6.0% |
| Immigrants | Iraq | 84.8 /100 | #143 | Excellent 6.0% |
| Koreans | 84.4 /100 | #144 | Excellent 6.0% |
| Arabs | 84.0 /100 | #145 | Excellent 6.0% |
| French Canadians | 82.6 /100 | #146 | Excellent 6.0% |
| Immigrants | Jordan | 82.3 /100 | #147 | Excellent 6.0% |
| Scotch-Irish | 82.0 /100 | #148 | Excellent 6.0% |
| Immigrants | Albania | 81.5 /100 | #149 | Excellent 6.1% |
| Zimbabweans | 80.7 /100 | #150 | Excellent 6.1% |
| Immigrants | Southern Europe | 80.5 /100 | #151 | Excellent 6.1% |
| Pakistanis | 79.2 /100 | #152 | Good 6.1% |
| Immigrants | Brazil | 78.9 /100 | #153 | Good 6.1% |
| Immigrants | Philippines | 78.5 /100 | #154 | Good 6.1% |
| Whites/Caucasians | 76.5 /100 | #155 | Good 6.1% |
| Native Hawaiians | 75.0 /100 | #156 | Good 6.1% |