Palestinian vs Immigrants from Albania Single Mother Households
COMPARE
Palestinian
Immigrants from Albania
Single Mother Households
Single Mother Households Comparison
Palestinians
Immigrants from Albania
5.9%
SINGLE MOTHER HOUSEHOLDS
92.1/ 100
METRIC RATING
130th/ 347
METRIC RANK
6.1%
SINGLE MOTHER HOUSEHOLDS
81.5/ 100
METRIC RATING
149th/ 347
METRIC RANK
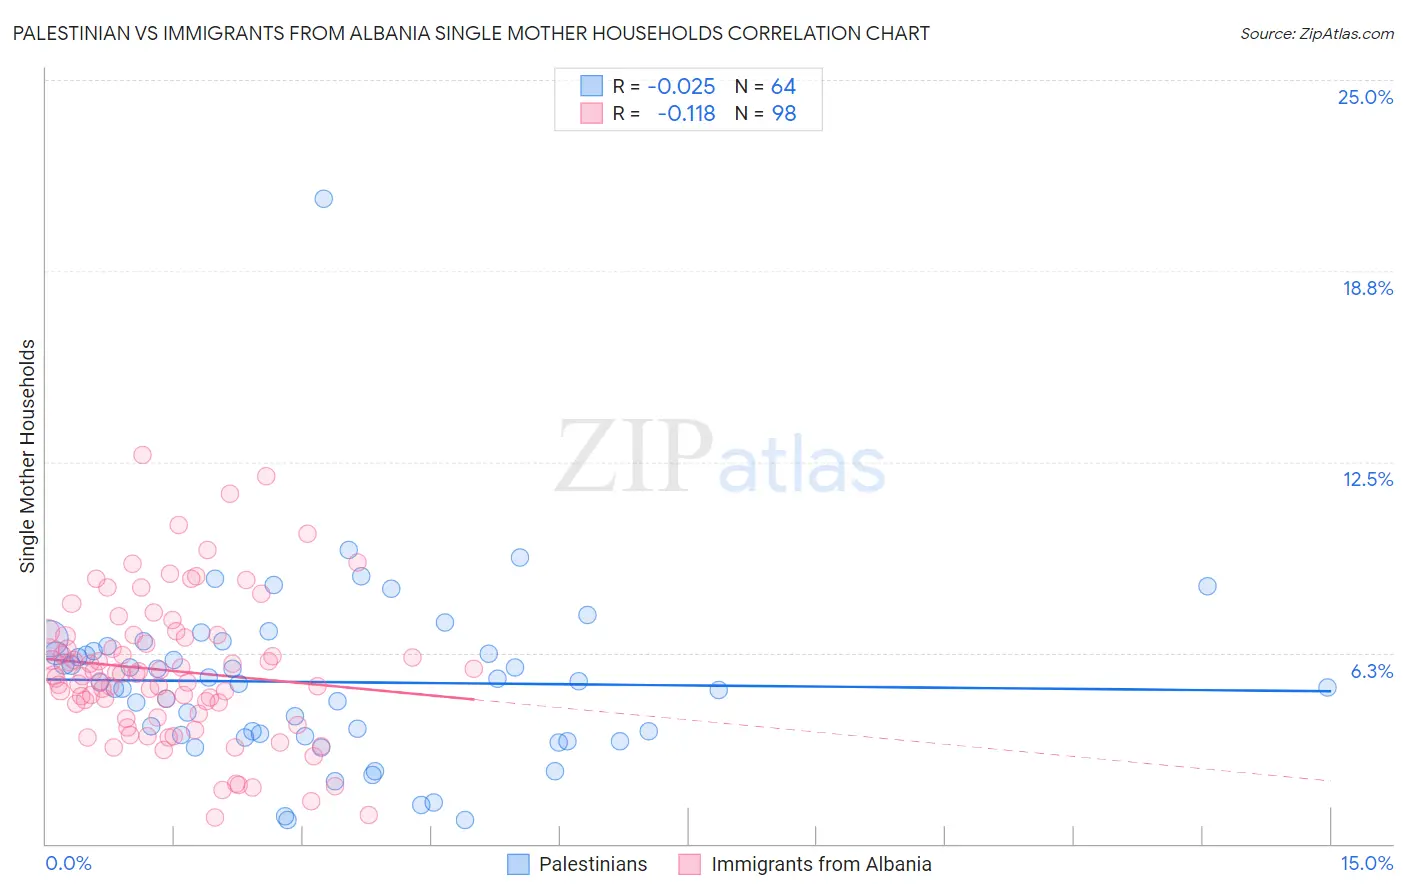
Palestinian vs Immigrants from Albania Single Mother Households Correlation Chart
The statistical analysis conducted on geographies consisting of 216,255,094 people shows no correlation between the proportion of Palestinians and percentage of single mother households in the United States with a correlation coefficient (R) of -0.025 and weighted average of 5.9%. Similarly, the statistical analysis conducted on geographies consisting of 119,328,901 people shows a poor negative correlation between the proportion of Immigrants from Albania and percentage of single mother households in the United States with a correlation coefficient (R) of -0.118 and weighted average of 6.1%, a difference of 2.9%.
Single Mother Households Correlation Summary
| Measurement | Palestinian | Immigrants from Albania |
| Minimum | 0.78% | 0.85% |
| Maximum | 21.1% | 12.7% |
| Range | 20.3% | 11.9% |
| Mean | 5.3% | 5.7% |
| Median | 5.3% | 5.5% |
| Interquartile 25% (IQ1) | 3.5% | 4.2% |
| Interquartile 75% (IQ3) | 6.4% | 6.8% |
| Interquartile Range (IQR) | 2.8% | 2.6% |
| Standard Deviation (Sample) | 2.9% | 2.3% |
| Standard Deviation (Population) | 2.9% | 2.3% |
Demographics Similar to Palestinians and Immigrants from Albania by Single Mother Households
In terms of single mother households, the demographic groups most similar to Palestinians are Immigrants from Bolivia (5.9%, a difference of 0.030%), Immigrants from Spain (5.9%, a difference of 0.35%), Albanian (5.9%, a difference of 0.39%), Egyptian (5.9%, a difference of 0.55%), and Canadian (5.9%, a difference of 0.61%). Similarly, the demographic groups most similar to Immigrants from Albania are Scotch-Irish (6.0%, a difference of 0.10%), Immigrants from Jordan (6.0%, a difference of 0.15%), French Canadian (6.0%, a difference of 0.21%), Arab (6.0%, a difference of 0.50%), and Korean (6.0%, a difference of 0.59%).
| Demographics | Rating | Rank | Single Mother Households |
| Immigrants | Bolivia | 92.2 /100 | #129 | Exceptional 5.9% |
| Palestinians | 92.1 /100 | #130 | Exceptional 5.9% |
| Immigrants | Spain | 91.2 /100 | #131 | Exceptional 5.9% |
| Albanians | 91.1 /100 | #132 | Exceptional 5.9% |
| Egyptians | 90.7 /100 | #133 | Exceptional 5.9% |
| Canadians | 90.5 /100 | #134 | Exceptional 5.9% |
| Immigrants | Saudi Arabia | 90.2 /100 | #135 | Exceptional 5.9% |
| Jordanians | 88.9 /100 | #136 | Excellent 6.0% |
| Immigrants | Pakistan | 88.4 /100 | #137 | Excellent 6.0% |
| Icelanders | 86.9 /100 | #138 | Excellent 6.0% |
| Syrians | 86.0 /100 | #139 | Excellent 6.0% |
| French | 85.7 /100 | #140 | Excellent 6.0% |
| Tsimshian | 85.2 /100 | #141 | Excellent 6.0% |
| Immigrants | Egypt | 85.0 /100 | #142 | Excellent 6.0% |
| Immigrants | Iraq | 84.8 /100 | #143 | Excellent 6.0% |
| Koreans | 84.4 /100 | #144 | Excellent 6.0% |
| Arabs | 84.0 /100 | #145 | Excellent 6.0% |
| French Canadians | 82.6 /100 | #146 | Excellent 6.0% |
| Immigrants | Jordan | 82.3 /100 | #147 | Excellent 6.0% |
| Scotch-Irish | 82.0 /100 | #148 | Excellent 6.0% |
| Immigrants | Albania | 81.5 /100 | #149 | Excellent 6.1% |